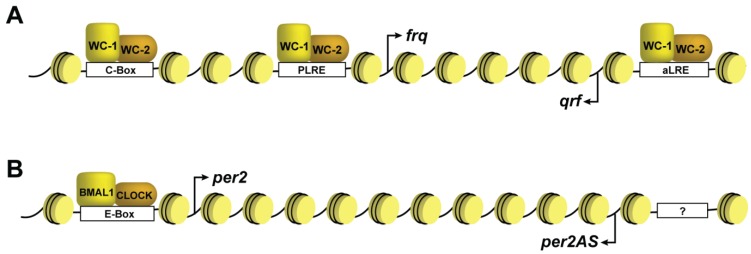
Figure 2.
Schematic of the clock genes. Illustration of (A) the frq gene in Neurospora and (B) the Per2 gene in mammals, shown as the typical “beads on string” with nucleosomes shaded yellow. The figure illustrates the sense and antisense transcripts that originate from both loci. The cis-acting sequences are shown as boxes on the DNA and labeled accordingly. The “?” within the Per2AS promoter indicates that the transcription factors responsible for expression are still unknown. Note that these representations are not drawn to scale.

