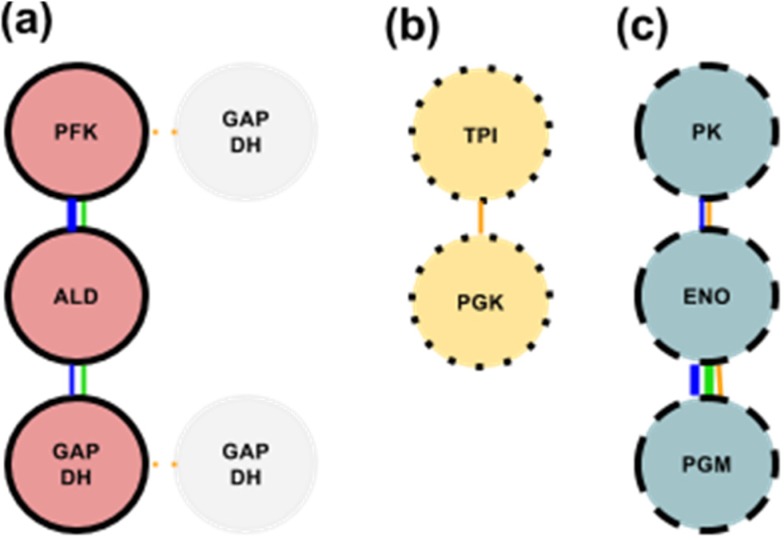
Figure 2.
(a) GlySCx1 denoted by intact black borders and red interior with the second possible GAPDH in gray at the two possible positions, (b) GlySCx2 with members denoted by dotted borders and yellow interior, (c) GlySCx3 with members denoted with dashed borders and blue interior. Connecting lines represent a specific interaction between the enzymes with the color relating to the type of study that has shown an interaction (see Table 1 for color code). Interactions that are supported by three or more studies are indicated with a thick line and interactions that are supported by less than three studies are indicated with a thin line. Each circle represents an entire functional enzyme (subunits included).

