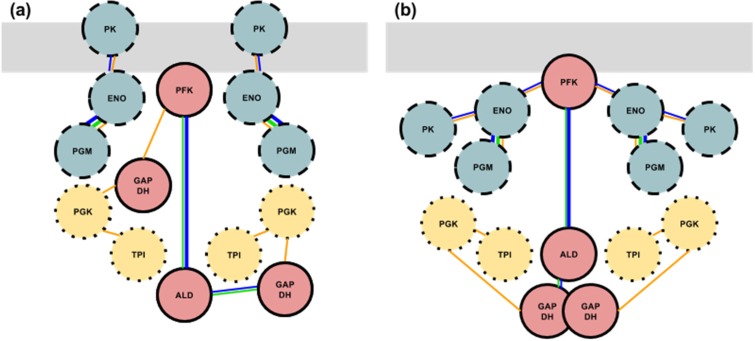
Figure 3.
Two possibilities for how the three subcomplexes could form a full, active glycolytic complex. The members of the triose pathway are doubled in accordance with previous stoichiometric experimental studies [23]. Each circle represents an entire enzyme (i.e., all subunits). The grey bar represents a thin filament composed of F-actin, troponin and tropomyosin. The three subcomplexes are designated by their appropriate borders and colors (see Figure 2). Lines connecting the enzymes indicate a specific interaction as described in Figure 2. Physical contact of GAPDH represents self-binding.

