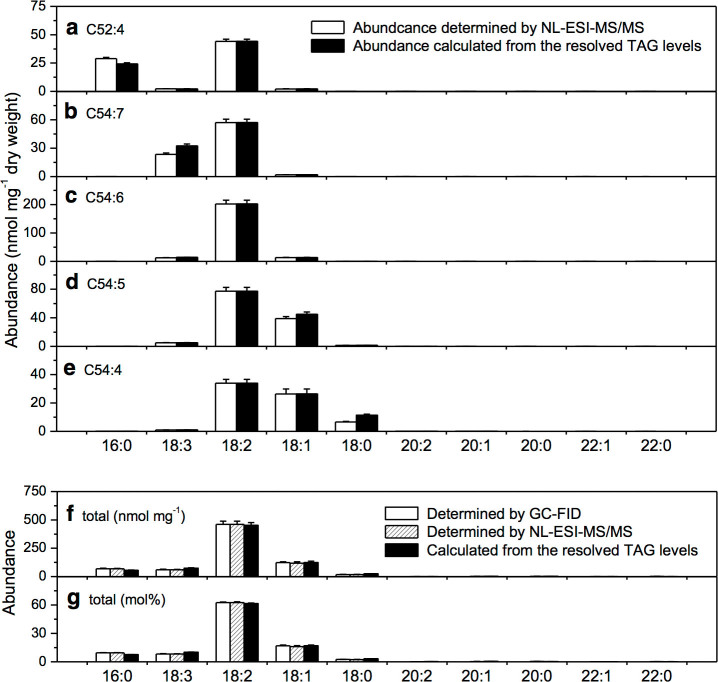
Figure 3. Evaluation of the quantification accuracy for the resolved TAG species.
(a) Fatty acyl abundance at C52:4 determined by NL-ESI-MS/MS and from the levels of resolved TAG species. (b–e) Fatty acyl abundance at C54:7, C54:6, C54:5, and C54:4 determined by NL-ESI-MS/MS and from the levels of resolved TAG species. (f–g) Absolute and relative levels of fatty acids in soybean seeds determined by GC-FID, by NL-ESI-MS/MS, and from the levels of the resolved TAG species. Values were means ± SE (n = 5).

