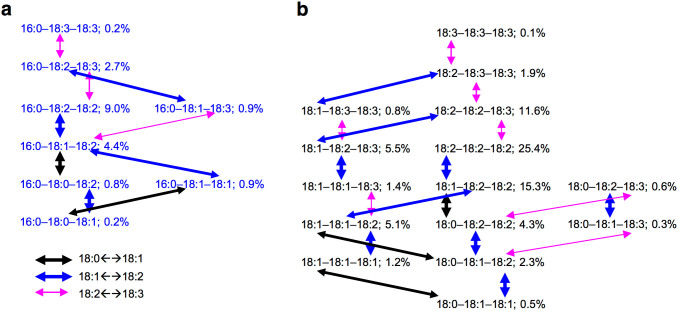
Figure 4. Comparison of the levels of two TAG species that differ in one acyl chain.
(a) Eight 16:0-containing TAG species that accounted for 19% of the total TAGs. (b) Fifteen TAG species with fatty acyl chains of 18:0, 18:1, 18:2, or 18:3 that accounted for 76% of the total TAGs. Dark arrow points to the different fatty acyl chains between two TAG species (18:0 or 18:1); Blue arrow points to the different fatty acyl chains between two TAG species (18:1 or 18:2); and pink arrow points to the different fatty acyl chains between two TAG species (18:2 or 18:3).

