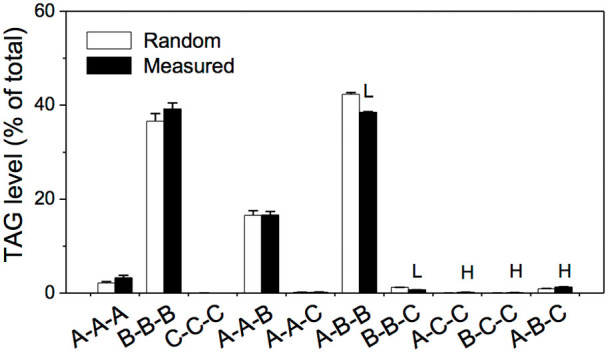
Figure 5. Pattern comparison between the TAGs whose fatty acyl combinations were randomly selected and the ones that were measured by NL-ESI-MS/MS.

Letter A refers to 16:0, 18:0, or 18:1; B refers to 18:2 or 18:3; C refers to 20:2, 20:1, 20:0, 22:1, or 22:0. The resolved TAGs listed in Table 1 accounts for 99.2 mol% while the combined TAG groups account for 0.8 mol%. The levels of resolved TAGs were applied to count the different TAG types. The sn-position of acyl chains are not specified in the description of TAG molecules in this work. A chi-square test has been performed to compare the difference between observed group pattern and expected group pattern and the p value is 0.996, which is larger than 0.05 and indicates that the difference is not significant. HSignificantly higher and LSignifcantly lower, each at P < 0.05, compared with the randomized acyl combination and measured combination, based on Student's t test. Values were means ± SE (n = 5).
