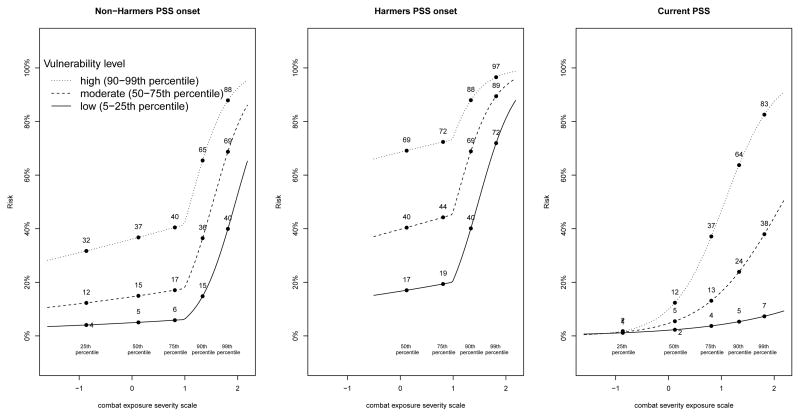
Figure 1. Estimated ratesa of PSS onset (left and middle by harmer status) and current PSS (right) as a function of both combat exposure severity and vulnerability loadb.
aEstimated rates are obtained from best fitting logistic regression models for PSS onset and current PSS. For PSS onset the best model was Model 3 including an indicator of harm and a change point in increased log odds risk at +1 standard deviation on the combat exposure severity scale (approximately the 75th percentile). For current PSS the best fitting model was Model 1 additionally including a cross-product between combat exposure severity and vulnerability. Estimated rates presented are for fixed values of vulnerability and exposure corresponding to low, moderate and high percentiles of each variable. To avoid extrapolation to combinations of predictors with no observations, no estimates are given for PSS onset among Harmers at low end of combat exposure severity scale.

