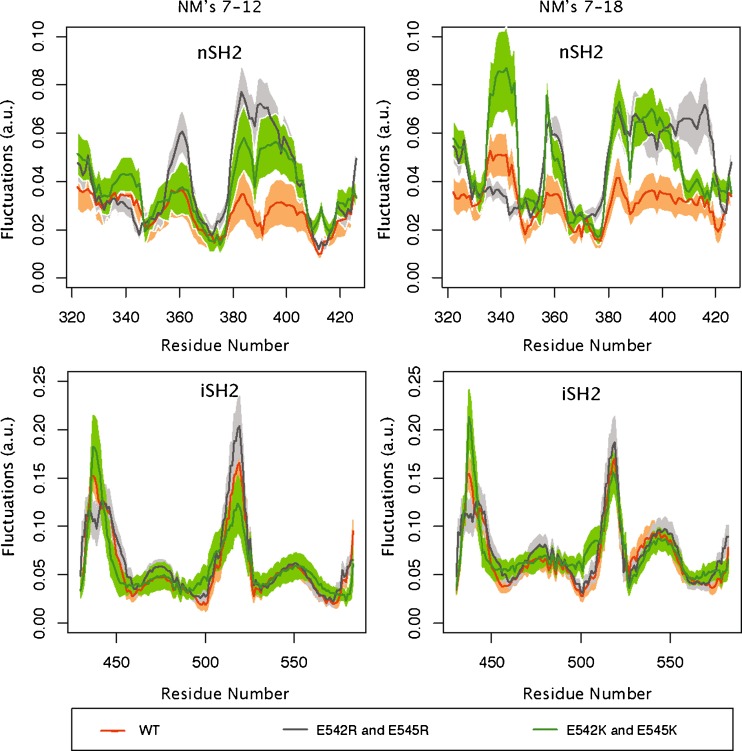
Fig. 4.
Fluctuations of the nSH2 and iSH2 p85α domains. Normal modes were computed by the Anisotropic Network Model (Atilgan et al. 2001). The profiles calculated by generating random linear combinations of the amplitudes of the lowest first six (left) or first 12 (right) vibrational modes. Fluctuations of the wild-type PI3Kα (p110α/ni SH2 p85α) are in orange, fluctuations of the E542R/E545R mutant in the p110α/niSH2 p85α are in gray, and those of the E542K/E545K mutant in the p110α/nip85α complex are in green

