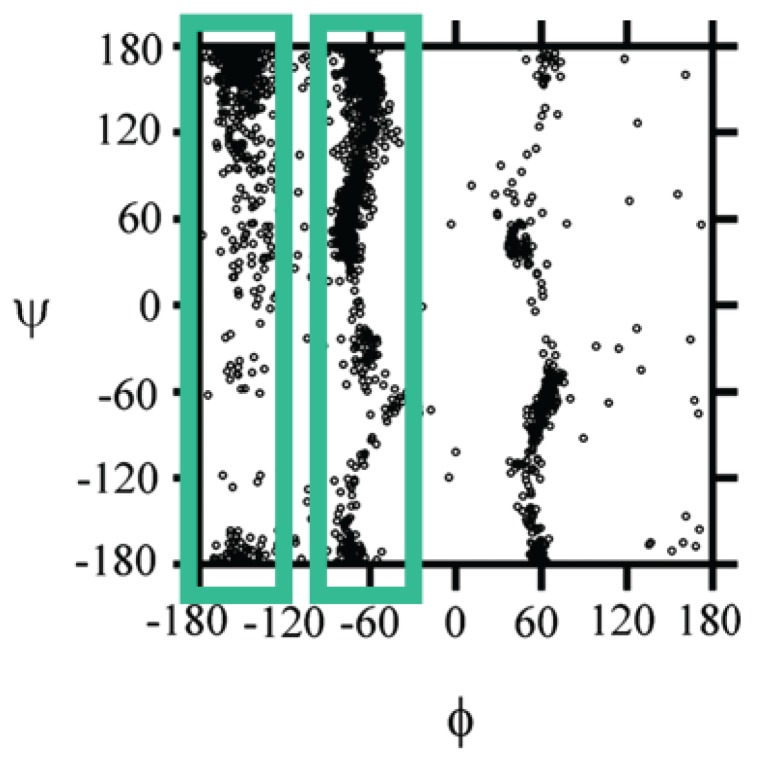
Figure 6.
Ramachandran map superimposing the backbone distributions of all residues and all conformational families of the XAO peptide calculated by MD SA with NMR derived time-averaged restraints. The green boxes indicate the two dominant conformational clusters centered at ϕ = −160°, (mainly extended β-strand-like structures) and ϕ = −70° (pPII and β-turn-like conformations). (Taken from ref. [69] and modified).

