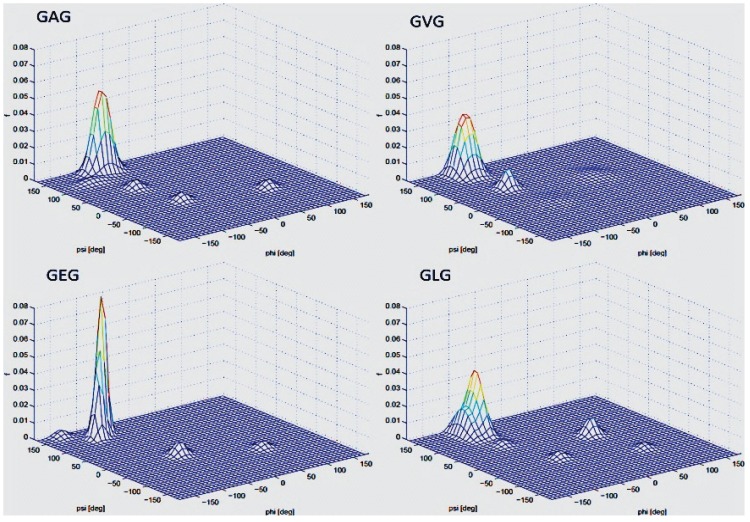
Figure 14.
Conformational distributions of the central residue in GAG, GVG, GLG, and GEG obtained from analysis of amide I’ band profiles and J coupling constants, illustrating the 2D distribution approach used by Hagarman et al. (Taken from ref. [52] with permission).

