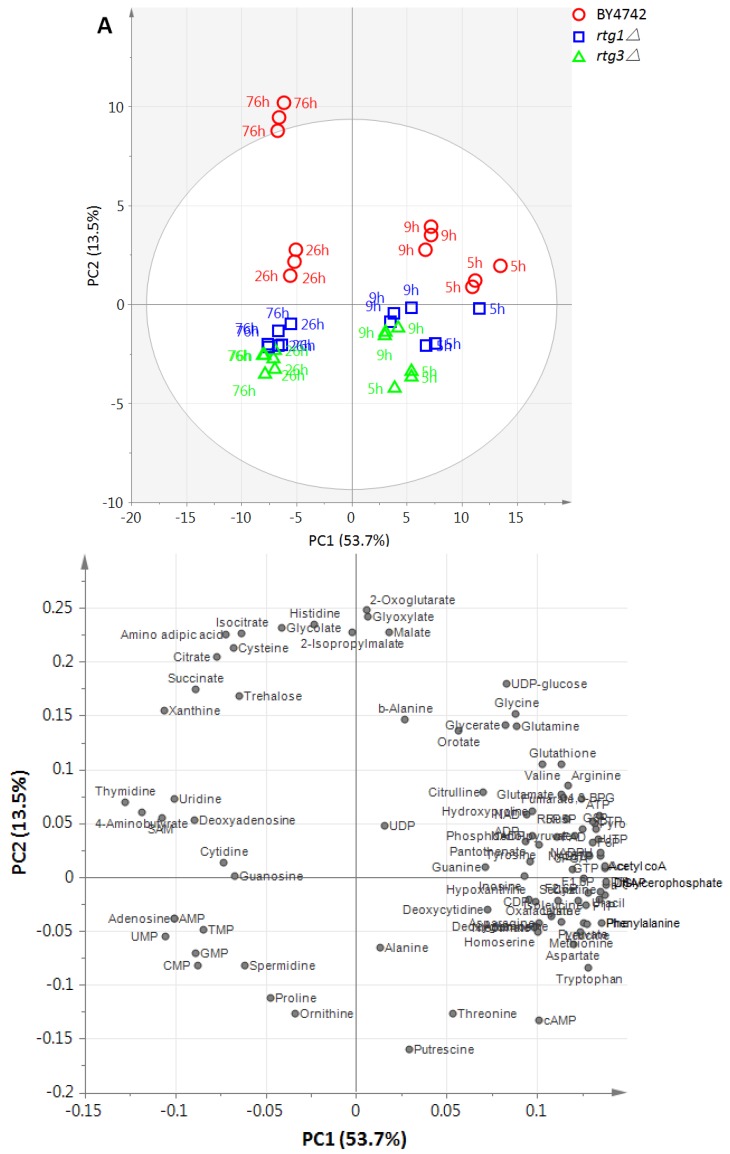
Figure 1.
(A) PCA score plot for time-course metabolic profiling of wild-type strain BY4742 and the rtg1∆ and rtg3∆ mutants (n = 3). The metabolites were normalized to an internal standard and auto-scaled. The ellipse indicates the 95% confidence border based on Hotelling’s T2. Separation among different sampling points (different growth phases) can be seen along PC1, while the separation between WT and mutant strains was observable on PC2. (B) The corresponding loading plot illustrating metabolites that contribute to the separation on PC1 and PC2 (see Supplementary Table S2 for the loading values).

