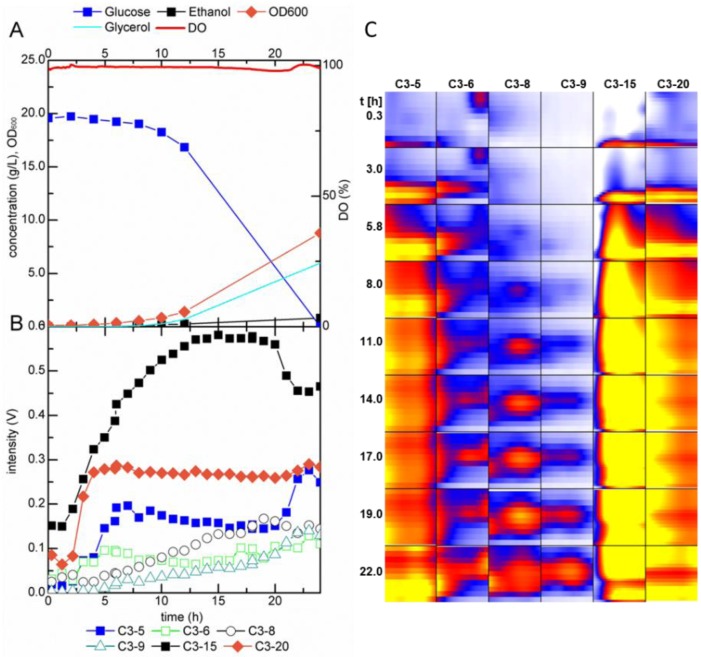
Figure 5.
(A) Fermentation profile of S. cerevisiae adh1Δ during batch growth in glucose minimal medium and (B) trends in intensity and (C) heat map of selected peaks detected by MCC-IMS analysis of the fermentation off-gas. The areas in the heat map show the detected analyte peak and the surrounding area; DO = dissolved oxygen.

