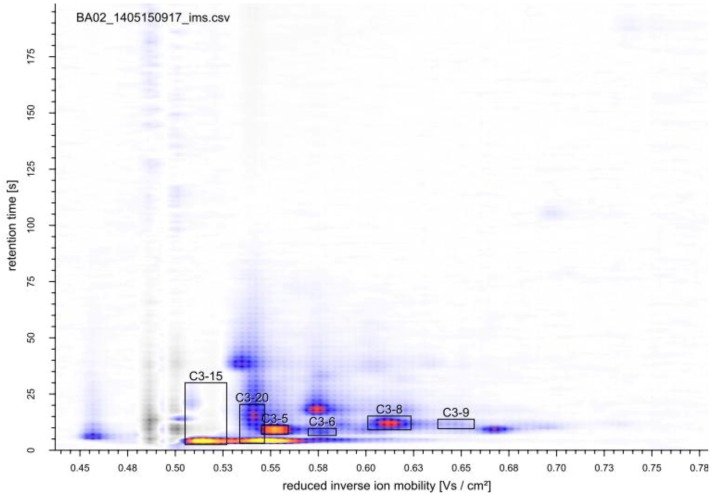
Figure 6.
MCC-IMS topographic plot of the off-gas of a glucose-limited continuous cultivation of S. cerevisiae. Boxes indicate analytes with the most significant changes during the growth (perturbation) experiments. The reaction ion peak (1/K0 = 0.5 Vs cm−2) was compensated by the VisualNow software.

