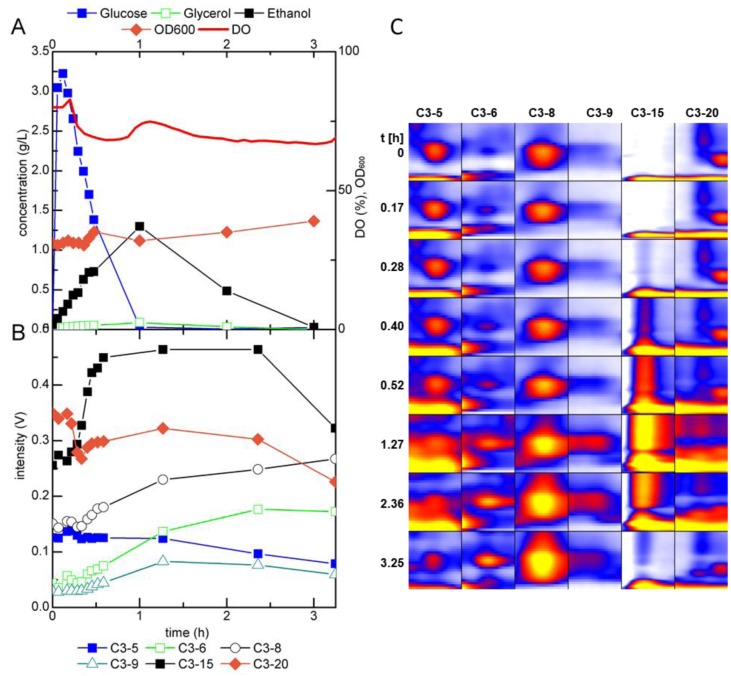
Figure 7.
(A) Fermentation profile of S. cerevisiae during growth in a glucose-limited chemostat and (B) trends in intensity and (C) heat map of selected peaks detected by MCC-IMS measurements of the fermentation off-gas after perturbation of the metabolic steady state with a pulse of 22 mmol glucose; DO = dissolved oxygen.

