
Figure 3. SUMOylation shifts the dependence of exocytosis from non-L-type to L-type voltage-dependent Ca2+ channels (VDCCs).
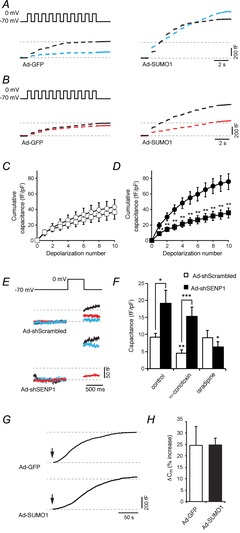
We measured exocytosis as increases in membrane capacitance in mouse α-cells, identified by glucagon immunostaining, in response to membrane depolarization. A, representative capacitance responses of α-cells infected with green fluorescent protein (Ad-GFP) or SUMO1 (Ad-SUMO1) under control conditions (black traces) or in the presence of 100 nm ω-conotoxin (blue traces). B, representative capacitance responses of α-cells infected with Ad-GFP or Ad-SUMO1 under control conditions (black traces) or in the presence of 5 μm isradipine (red traces). C, the cumulative capacitance response from α-cells expressing Ad-GFP in the absence (open circles) and presence (open squares) of 5 μm isradipine. D, the cumulative capacitance response from α-cells expressing Ad-SUMO1 in the absence (black circles) and presence (black squares) of 5 μm isradipine. E, representative capacitance traces in response to a single depolarization of α-cells infected with a scrambled control (Ad-Scrambled) or an shRNA sequence targeted against SENP1 (Ad-shSENP1) in the absence of a voltage-dependent Ca2+ channel (VDCC) inhibitor (black traces), or in the presence of 100 nm ω-conotoxin (blue traces) or 5 μm isradipine (red traces). F, average capacitance responses to the single depolarization in cells infected with Ad-Scrambled (open bars) or Ad-shSENP1 (black bars) in the absence or presence of 100 nm ω-conotoxin and 5 μm isradipine. G, continuous recording of membrane capacitance during infusion of 200 nm free Ca2+ following establishment of whole-cell access (arrows). H, the percentage increase in membrane capacitance (Cm) over 200 s. *P < 0.05, **P < 0.01, ***P < 0.001 for comparisons with the respective control, or as indicated.