
Figure 2. SR and cytoplasmic Ca2+ during prolonged Ca2+ release.
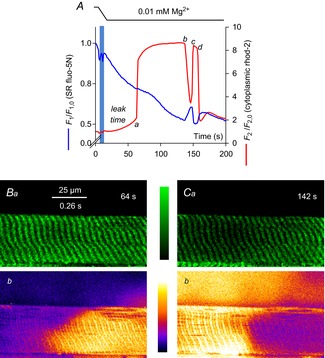
The spatially averaged fluorescence values for each frame in an xyt series of SR-trapped fluo-5N fluorescence (blue line) and cytoplasmic rhod-2 fluorescence (red line) from a rat skinned fibre during the lowering of [Mg2+]cyto is plotted in A. The interval of solution change is indicated by the horizontal bars at top and the vertical blue bar on the profile. a–d refer to the Ca2+ release and termination of release events. These events are described in the text and analysed in Fig. 6. Lowering [Mg2+]cyto causes Ca2+ to initially leak from SR, marked leak time and indicated by the rise in cytoplasmic rhod-2 fluorescence up to the position marked a (see Fig. 5). Images from the rise (B) and decline (C) of the Ca2+ transient induced by lowering [Mg2+]cyto are shown. The background of the fluo-5N fluorescence image has been subtracted and the image median filtered. Time stamp in top right-hand corner of fluo-5N fluorescence image corresponds to that of the spatially averaged values of rhod-2 and fluo-5N fluorescence shown in A. A ‘halo’ of Ca2+ released from the fibre was observed in C (see Methods). SR, sarcoplasmic reticulum.