
Figure 3. Following prolonged Ca2+ release resequestered cytoplasmic Ca2+ provides the driving force for briefer Ca2+ transients to start.
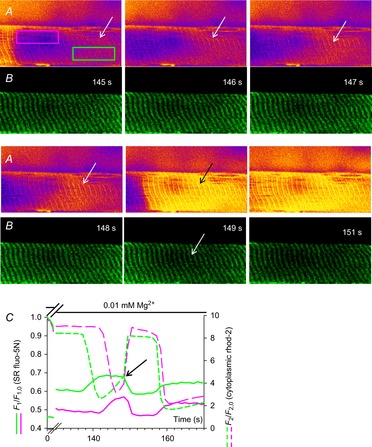
Selected images cytoplasmic rhod-2 fluorescence (A) and SR trapped fluo-5N fluorescence (B) following the exchange of standard internal bathing solution for low [Mg2+]cyto solution bathing a rat skinned fibre. The spatially restricted fluorescence values of cytoplasmic rhod-2 fluorescence and SR trapped fluo-5N fluorescence of the fibre bound by the pink and green boxes (indicated in the first image in A) are plotted against time in C for a selected section of this experiment (full experiment presented in Fig. 2). The white arrows in B from time-points 145 s to 148 s indicate a region of increasing cytoplasmic rhod-2 fluorescence intensity while the SR-trapped fluo-5N fluorescence remains relatively high and constant. The black arrow in A at time-point 149 s indicates a rapid increase in cytoplasmic rhod-2 fluorescence compared to the previous 3 s and a rapid decline in SR-trapped fluo-5N fluorescence. These events in this restricted region of the fibre are shown in profile in the green lines in C. The black arrow in C indicates the change in rate of increase of rhod-2 cytoplasmic fluorescence that correlates with net SR-trapped fluo-5N fluorescence turning negative. The profiles in the pink line in C represents the fluorescence values of SR-trapped fluo-5N fluorescence and cytoplasmic rhod-2 fluorescence from the area marked with the pink box in A. A delay in Ca2+ movements is observed between the two locations (C). SR, sarcoplasmic reticulum.