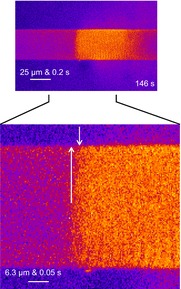
Figure 10. Propagation of Ca2+ waves is not driven by a cytoplasmic mechanism.

Selected cytoplasmic rhod-2 fluorescence image from Fig. 8 has been enlarged. The base of the first white arrow indicates the front of the Ca2+ wave, which is in the central region of the fibre, and the point of the arrow indicates a possible direction of propagation of the wave front. The second arrow indicates where the front of the wave meets the fibre edge. The distance, y, between the arrowheads, which also maps proportionally to t is used to determine the propagation rate if cytoplasmic propagation of Ca2+ is assumed to spread the wave front across the short axis of the fibre. Under this assumption, the rate of propagation would be close to 1 mm s−1.
