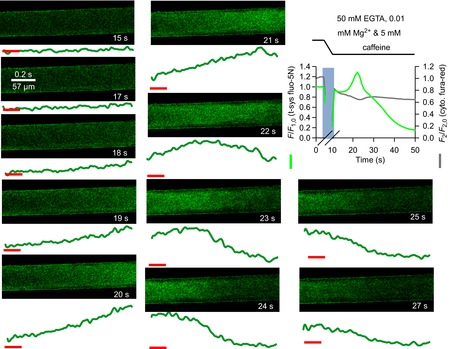
Figure 12. t-system Ca2+ during prolonged sarcoplasmic reticulum Ca2+ release in low Mg2+, 5 mm caffeine and 50 mm EGTA.

Spatially averaged values of t-system trapped fluo-5N fluorescence and cytoplasmic fura-red fluorescence during Ca2+ release induced by low Mg2+ and 5 mm caffeine in the presence of 50 mm EGTA following exchange from a solution containing 50 mm EGTA, 1 mm Mg2+ and 100 nm Ca2+ in a rat skinned fibre is shown top right. The lines at the top and pale vertical bar on the spatially averaged profile indicate the solution change. A slow uptake of Ca2+ by the t-system followed by a slow depletion is reported by t-system fluo-5N. The fura-red signal shows a peak trailed that of the t-system signal. Note that fura-red fluorescence is inversely proportional to [Ca2+]. Selected images of t-system trapped fluo-5N fluorescence are shown with time-stamps corresponding to that in the spatially averaged profile. Below each image are the spatially averaged values of t-system trapped fluo-5N fluorescence versus elapsed time (which maps proportionally to the abscissa of xy scans, see Methods). The horizontal red lines mark the arbitrary baseline for all images. Ca2+ increases in the t-system at right as the image is presented and moves to the left, followed by a depletion of Ca2+.
