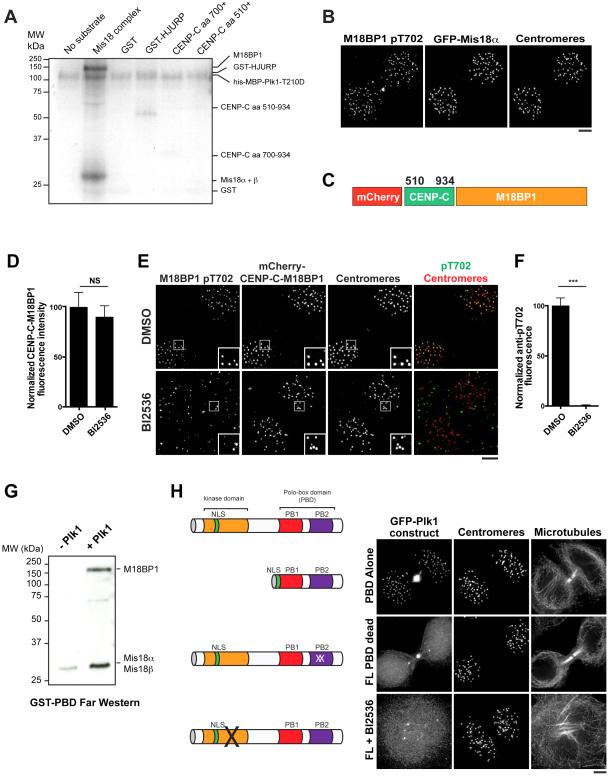
Figure 4. Plk1 binds to and phosphorylates the Mis18 complex.
A) Autoradiogram showing Plk1 phosphorylation of recombinant proteins in the CENP-A deposition pathway in the presence of 32P-ATP. The approximate migration of each protein is indicated on the right based on GelCode Blue staining (see Fig. S4B). aa: amino acid. B) Immunofluorescence images of G1 cells expressing GFP-Mis18α, co-stained with α-M18BP1 pT702. Centromeres are marked with α-CENP-A antibodies. C) Schematic of the CENP-C-M18BP1 fusion used to bypass regulated M18BP1 localization. Numbers represent amino acid positions within CENP-C. D) Quantification of mCherry-CENP-C-M18BP1 levels following treatment with BI2536 or DMSO as percent of DMSO levels. Both DMSO and BI2536-treated populations were depleted for endogenous M18BP1. Error bars represent s.e.m, n = 20 G1 cell pairs. NS: not significant, p > 0.05. E) Immunofluorescence images showing CENP-C-M18BP1-expressing cells stained for α-M1B81P pT702 following treatment with BI2536. Centromeres are identified with α-CENP-A antibody. F) Quantification of pT702 centromeric fluorescence in CENP-C-M18BP1-expressing cells following treatment with BI25356 (quantification of Fig. 4E). Error bars represent s.e.m, n = 20 G1 cell pairs, *** p < 0.001. G) Far-Western analysis of recombinant GST-PBD binding to the recombinant Mis18 complex in the presence or absence of Plk1. H) Left: schematic of modified GFP-Plk1 constructs. Right: Immunofluorescence images showing localization of modified GFP-Plk1 constructs: PBD alone (PBD truncation + nuclear localization signal), FL PBD dead (full length protein with mutations rendering the Polo-Box unable to bind to its substrates (Elia et al., 2003b)), FL + BI2536 (full-length protein after treatment with the Plk1 inhibitor BI2536). Images are scaled with γ adjustment. Scale bars = 5 μm. See also Fig. S4.

