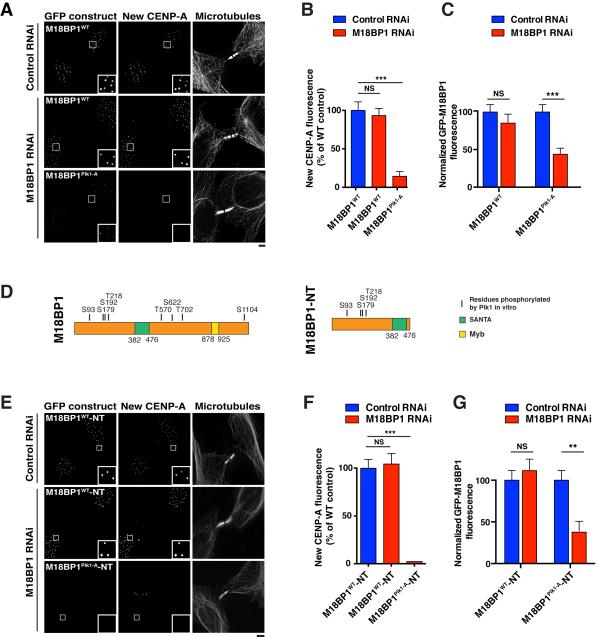
Figure 5. Plk1 phosphorylation of the Mis18 complex is required for CENP-A deposition.
A) Immunofluorescence images showing new CENP-A deposition in cells expressing GFP fusions of either M18BP1WT or M18BP1Plk1-A following treatment with the indicated siRNAs. New CENP-A is labeled using SNAP-Cell TMR-Star. B) Quantification of centromeric fluorescence intensity of new CENP-A-SNAP following replacement of endogenous M18BP1 with RNAi-resistant GFP-M18BP1WT or GFP-M18BP1Plk1-A. Numbers are presented as a percentage of the intensity in M18BP1WT cells + control RNAi. Error bars represent s.e.m, n = 20 G1 cell pairs. NS: not significant, p > 0.05; ***: p < 0.001. Wild type and mutant cell lines were generated from the same parental CENP-A-SNAP cell line (see Table S1) and after generation continue to have equivalent levels of total CENP-A-SNAP protein (data not shown). C) Quantification of centromeric GFP-M18BP1WT or GFP-M18BP1Plk1-A fluorescence intensity in cells in which M18BP1 has been depleted. Error bars represent s.e.m, n = 20 G1 cell pairs. ***: p < 0.001; NS: not significant, p > 0.05 (Student’s t-test). D) Left: Schematic of M18BP1 showing residues phosphorylated by Plk1 in vitro. Right: Schematic of an N Terminal domain of M18BP1 (M18BP1-NT) that is sufficient for M18BP1 centromere localization, Mis18α recruitment and CENP-A deposition. SANTA: SANT-associated domain; Myb: Myb DNA-binding domain. E) Immunofluorescence images showing new CENP-A deposition in cells expressing GFP fusions of either M18BP1WT-NT or M18BP1Plk1-A-NT following treatment with the described siRNAs. New CENP-A is labeled using SNAP-Cell TMR-Star. F) Quantification of centromeric fluorescence intensity of new CENP-A-SNAP following replacement of endogenous M18BP1 with RNAi-resistant GFP-M18BP1WT-NT or GFP-M18BP1Plk1-A-NT. Numbers are presented as a percentage of the intensity in M18BP1WT-NT cells + control RNAi. Error bars represent s.e.m, n = 20 G1 cell pairs. NS: not significant, p > 0.05; ***: p < 0.001. G) Quantification of centromeric GFP-M18BP1WT-NT or GFP-M18BP1Plk1-A-NT fluorescence intensity in cells in which M18BP1 has been depleted. Localization of GFP-M18BP1Plk1-A-NT is weak even in the presence of the endogenous protein (Fig. S5G). Error bars represent s.e.m, n = 20 G1 cell pairs. **: p < 0.005; NS: not significant, p > 0.05 (Student’s t-test). Scale bars = 5 μm. See also Fig. S5.

