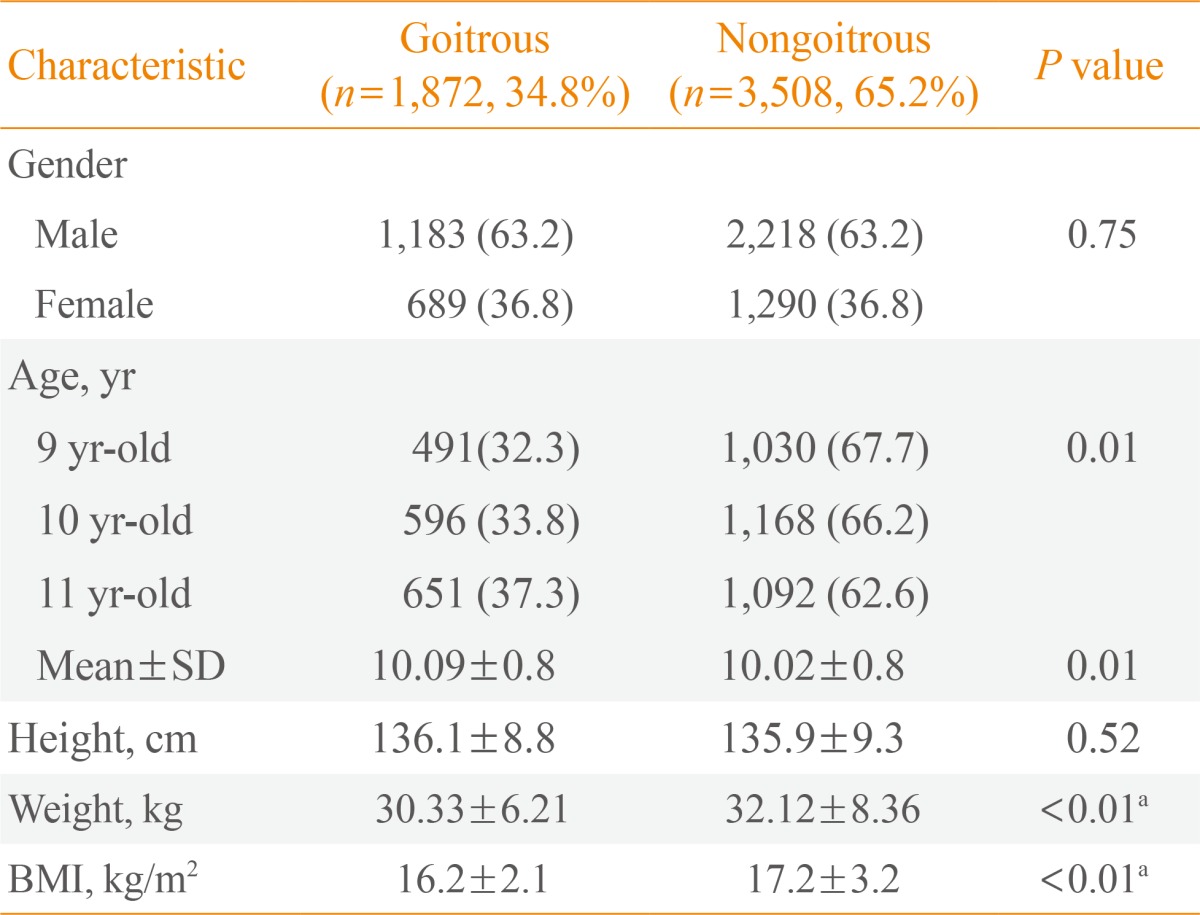
Table 1.
Characteristics of the Total Population of Goitrous and Nongoitrous Students

Values are expressed as number (%) or mean±SD.
SD, standard deviation; BMI, body mass index.
aStatistically significant.
Characteristics of the Total Population of Goitrous and Nongoitrous Students

Values are expressed as number (%) or mean±SD.
SD, standard deviation; BMI, body mass index.
aStatistically significant.