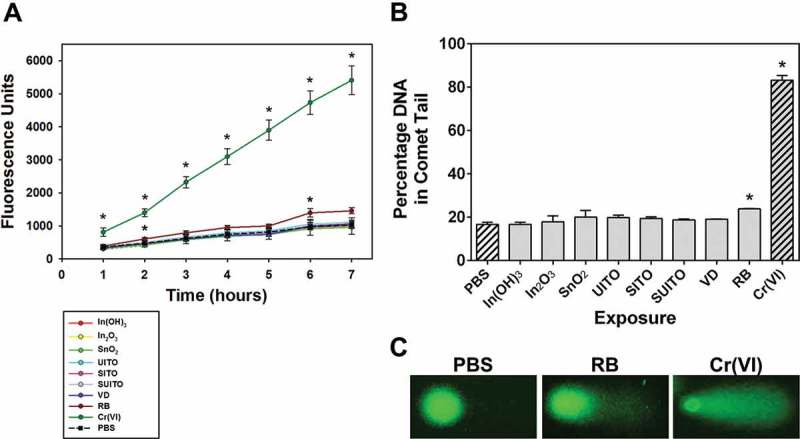
FIGURE 4.

Intracellular ROS production in cells following treatment with indium compounds. (A) RAW 264.7 cells were pretreated with DCFH-DA, exposed to 50 μg/ml indium compounds or 1 mM chromium(VI) as a positive control, and plates were read each hour to measure intracellular ROS. Error bars represent the mean ± SD (n = 6). Asterisk indicates significant at p < .05 compared to control cells (PBS) at that time point. (B) A comet assay was used to examine DNA damage from intracellular ROS. Cells were treated with 50 μg/ml indium compounds or 1 mM chromium(VI) for 3 h, washed and scraped into PBS, added to glass slides with agarose, then lysed and subjected to electrophoresis. SYBR green was added to stain double-stranded DNA. Images were acquired using fluorescence microscopy and a 40× objective. Cell comets were measured by comparing the corrected nuclear region fluorescence to the corrected total cell fluorescence. This was converted to a percentage to indicate DNA damage. Error bars represent the mean ± SD. Asterisk indicates significant at p < .05 compared to untreated cells (PBS). (C) Representative comets. RB; reclaim by-product, Cr(VI); chromium(VI).
