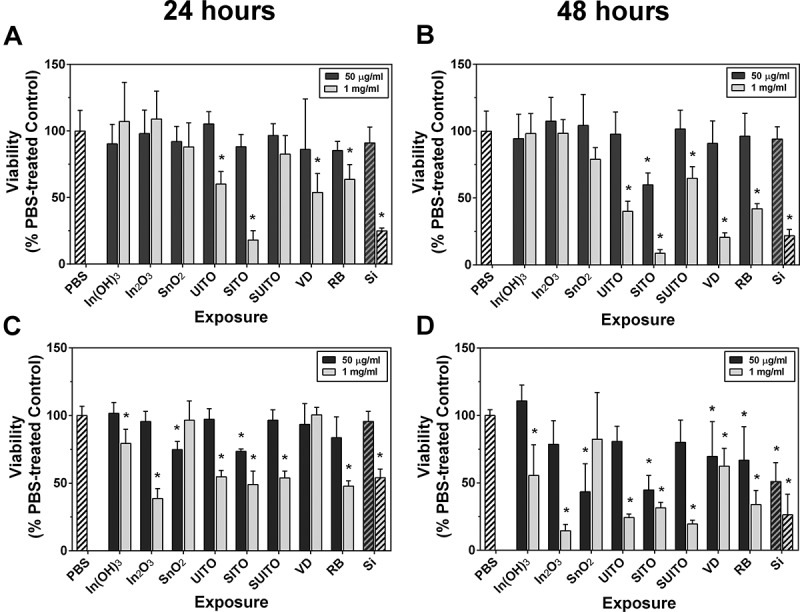
FIGURE 6.

Indium compounds reduce cell viability. (A, B) RAW 264.7 cells were treated with indium compounds or Min-U-sil (Si) and incubated at 37° C for 24 h (A) or 48 h (B). MTT was added to wells for the last 4 h, and absorbance was read at 570 nm. All values were normalized to PBS-treated control wells, which were calculated to represent 100% viability. (C, D) The same as in (A) and (B), except with BEAS-2B cells. Error bars represent the mean ± SD (n = 6). Asterisk indicates significant at p < .05 compared to PBS controls.
