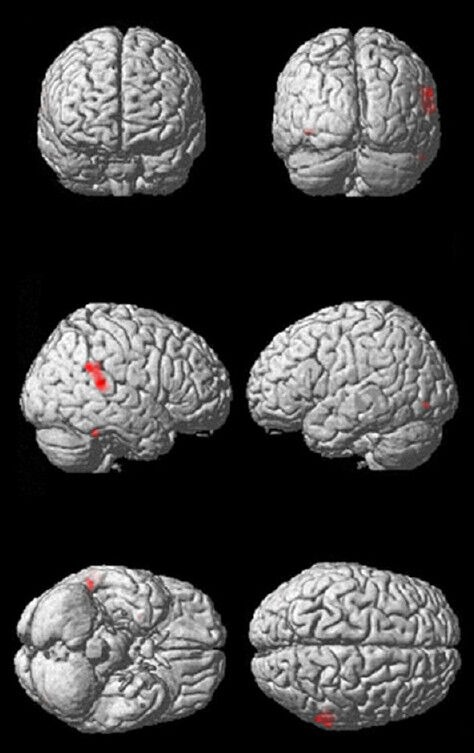
Figure 1.

Three-dimensional reconstruction of the brain indicating gray matter loss in type 2 diabetes compared with control.
The regions of gray matter loss are shown from anterior, posterior, right lateral, left lateral, inferior and superior view, respectively, and the red region represents the region of gray matter loss.
