
Figure 2.
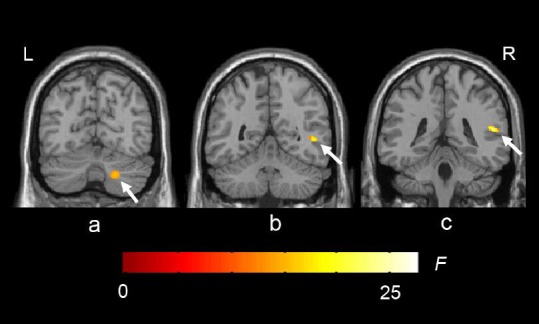
White matter loss in type 2 diabetes patients compared with normal controls.
The colored regions represent the regions of white matter loss. Arrows indicate right posterior cerebellar white matter loss (a), right middle temporal white matter loss (b) and right superior temporal white matter loss (c). R: Right; L: left. The underlying structure image is Ch2 image.