
Figure 3.
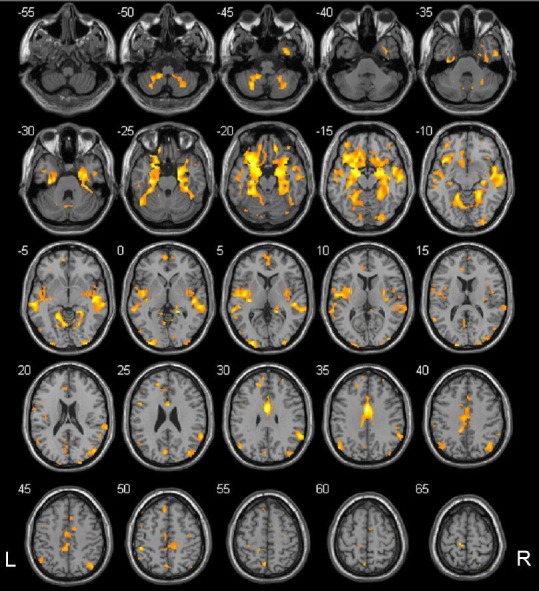
Regions where gray matter volumes positively correlated with ankle-brachial index in type 2 diabetes mellitus patients.
The colored regions represent the regions whose gray matter volumes correlated with ankle-brachial index. These regions were largely consistent with those in the default mode network. The underlying structure image is Ch2 image. The number at the left-top corner of each image represents the Montreal Neurological Institute (MNI) coordinate. R: Right; L: left.