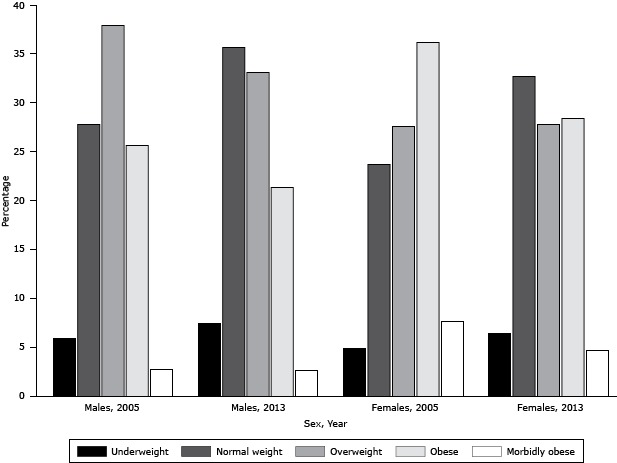
Figure 2.

Percentage change in distribution of body mass index (BMI) categories from 2005 through 2013, for men and women, Kingdom of Saudi Arabia. Categories are underweight (BMI <18.5), normal weight (BMI 18.5–24.9), overweight (BMI 25.0–29.9), obese (BMI 30.0−39.9), or morbidly obese (BMI ≥ 40).
| Sex/Year | Underweight | Normal Weight | Overweight | Obese | Morbidly Obese |
|---|---|---|---|---|---|
| Males, 2005 | 5.9 | 27.8 | 37.9 | 25.6 | 2.7 |
| Males, 2013 | 7.4 | 35.6 | 33.1 | 21.3 | 2.6 |
| Females, 2005, | 4.9 | 23.7 | 27.6 | 36.2 | 7.6 |
| Females, 2013 | 6.4 | 32.7 | 27.8 | 28.4 | 4.7 |
