
Figure 2.
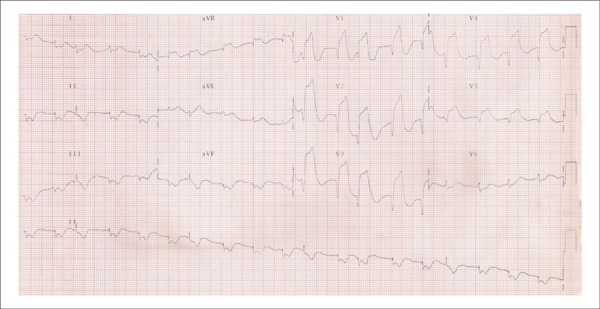
ECG: low QRS voltage in the frontal plane, electrically inactive lower wall area and anterior myocardial infarction with increased ST elevation, still with positive T waves, "hyperacute phase of myocardial infaction".
Official websites use .gov
A
.gov website belongs to an official
government organization in the United States.
Secure .gov websites use HTTPS
A lock (
) or https:// means you've safely
connected to the .gov website. Share sensitive
information only on official, secure websites.
ECG: low QRS voltage in the frontal plane, electrically inactive lower wall area and anterior myocardial infarction with increased ST elevation, still with positive T waves, "hyperacute phase of myocardial infaction".