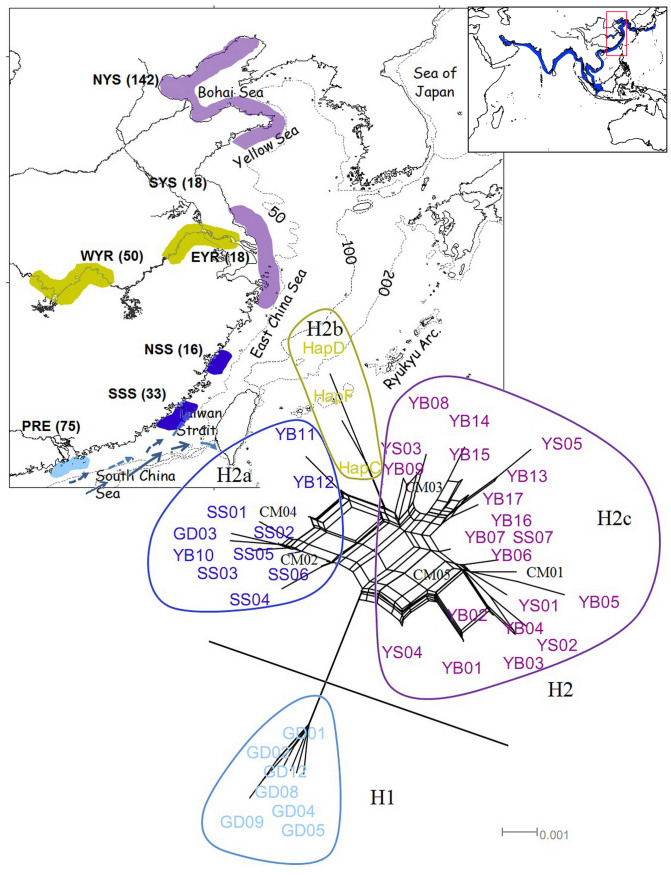
Figure 1. Sampling sites and SplitsTree of Neophocaena based on control regions.
Four haplogroups/subgroups are marked with different colors according to their clustering pattern (light blue: N. phocaenoides from PRE; dark blue: N. phocaenoides from Taiwan Strait; yellow: N. a. asiaeorientalis from the Yangtze River; and purple: N. a. sunameri from the Yellow/Bohai Sea and East China Sea). Five shared haplotypes are indicated in black. Seven populations are represented on the map with colors corresponding to the SplitsTree results. The numbers in the brackets indicate the sampling size of each locale. Dashed lines indicate 50, 100 and 200 m isobaths. The arrows indicate the direction of the Guangdong coastal current (dashed lines) and the South China Sea warm current (solid lines) in the summer. The box on the top right indicates the global distribution of Neophocaena. The map was generated using ArcGIS 9.2. The coastline and hydrologic data are available on the web at http://www.naturalearthdata.com/downloads/ (Public Domain; date accessed: Jun 2011) and http://www.mapcruzin.com/download-shapefile/asia-waterways-shape.zip (Open Database License 1.0; date accessed: Jun 2011).

