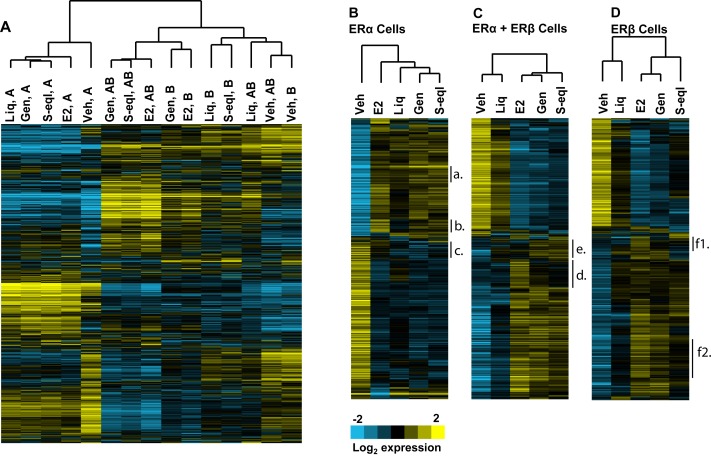
Figure 2. Hierarchical clustering of the genes regulated by BEs and E2 in the 3 ER cell backgrounds.
Hierarchical clustering is shown for all four compounds and cell backgrounds (Panel A), and individually for ERα only (Panel B), ERα + ERβ (Panel C), and ERβ only (Panel D) cells. Several identified clusters showing different patterns of gene regulation by the ligands in the different cell backgrounds are denoted by letters a-f.

