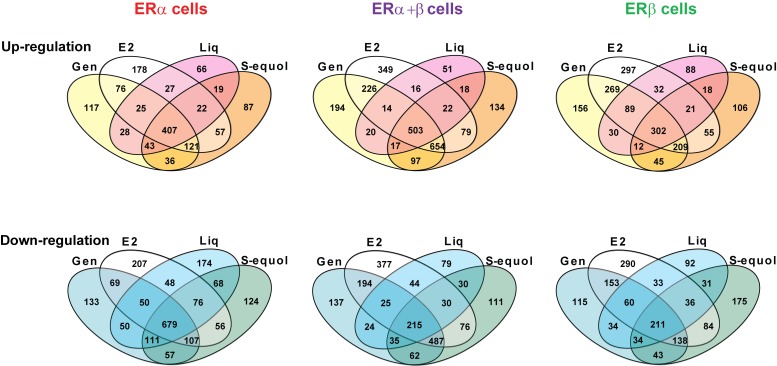
Figure 4. Comparison of the genes regulated by the three BEs and by E2 in the three ER cell backgrounds (ERα only, ERα + ERβ and ERβ only).
Cells were treated with genistein, S-equol or liquiritigenin (1 µM) or E2 (10 nM) for 24 h prior to harvest of RNA and further processing. Venn diagrams show overlap of BEs and E2 for up- and down-regulated genes in the three cell backgrounds.

