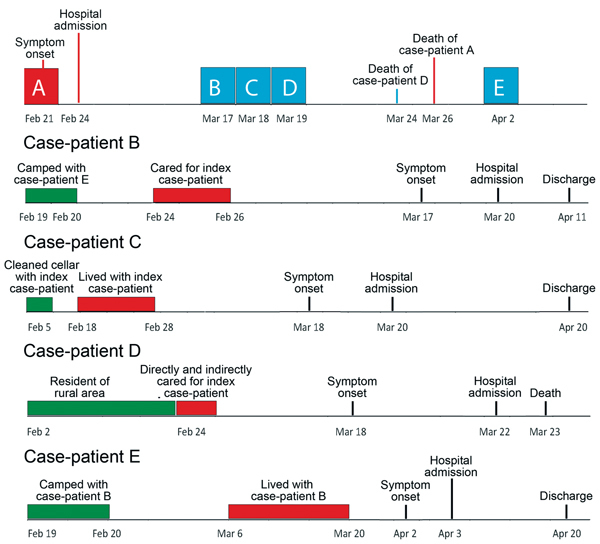
Figure 1.

Timelines showing progression and key events related to each case-patient (A–E) in a cluster of 5 Andes hantavirus cases, southern Chile, 2011. Blue boxes along timeline for index case-patient (A) indicate date of illness onset for subsequent case-patients; green boxes indicate environmental exposures (exposure for case-patient A was the same as for case-patient C); red boxes indicate contact with other case-patients.
