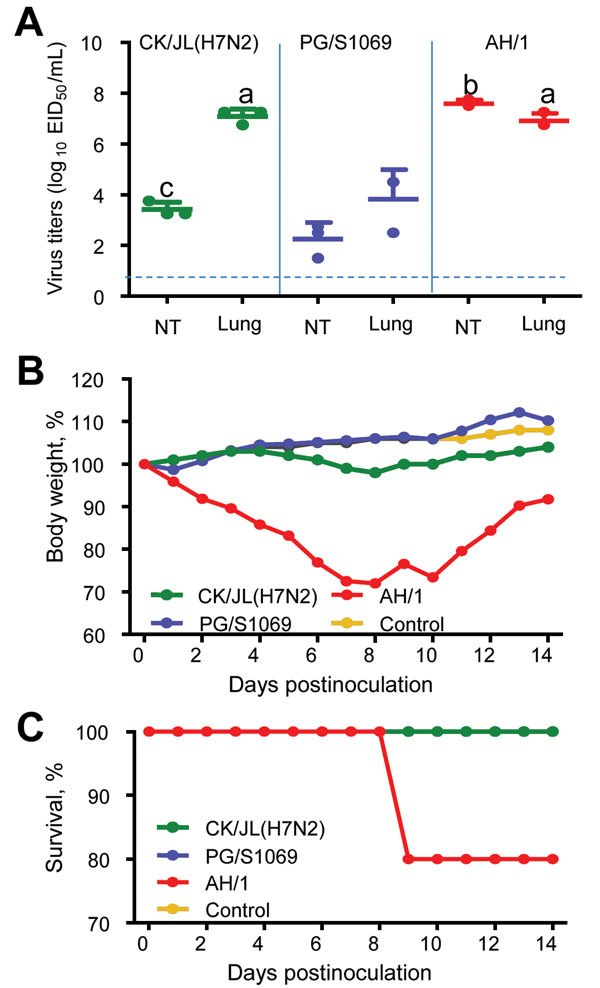
Figure 1.

Replication and virulence of avian influenza A virus subtypes H7N2 and H7N9 in mice. A) Virus titers in organs of mice. The data shown are the mean ± SD for each group. Because virus was not detected from spleen, kidney, or brain of any mouse, data for these organs are not shown. a, p<0.01 compared with the corresponding value for the A/pigeon/Shanghai/S1069/2013-inoculated group; b, p<0.01 compared with the corresponding value for the A/chicken/Jilin/SD020/2014(H7N2)-inoculated and A/pigeon/Shanghai/S1069/2013-inoculated groups; c, p<0.05 compared with the corresponding value for the A/pigeon/Shanghai/S1069/2013-inoculated group. The dashed line indicates the lower limit of detection. NT, nasal turbinates. B) Percentages of body weight changes of mice. C) Percentages of mice that survived. CK/JL (H7N2), A/chicken/Jilin/SD020/2014(H7N2); PG/S 1069, A/pigeon/Shanghai/S1069/2013; AH/1, A/Anhui/1/2013; EID50, 50% egg infectious dose.
