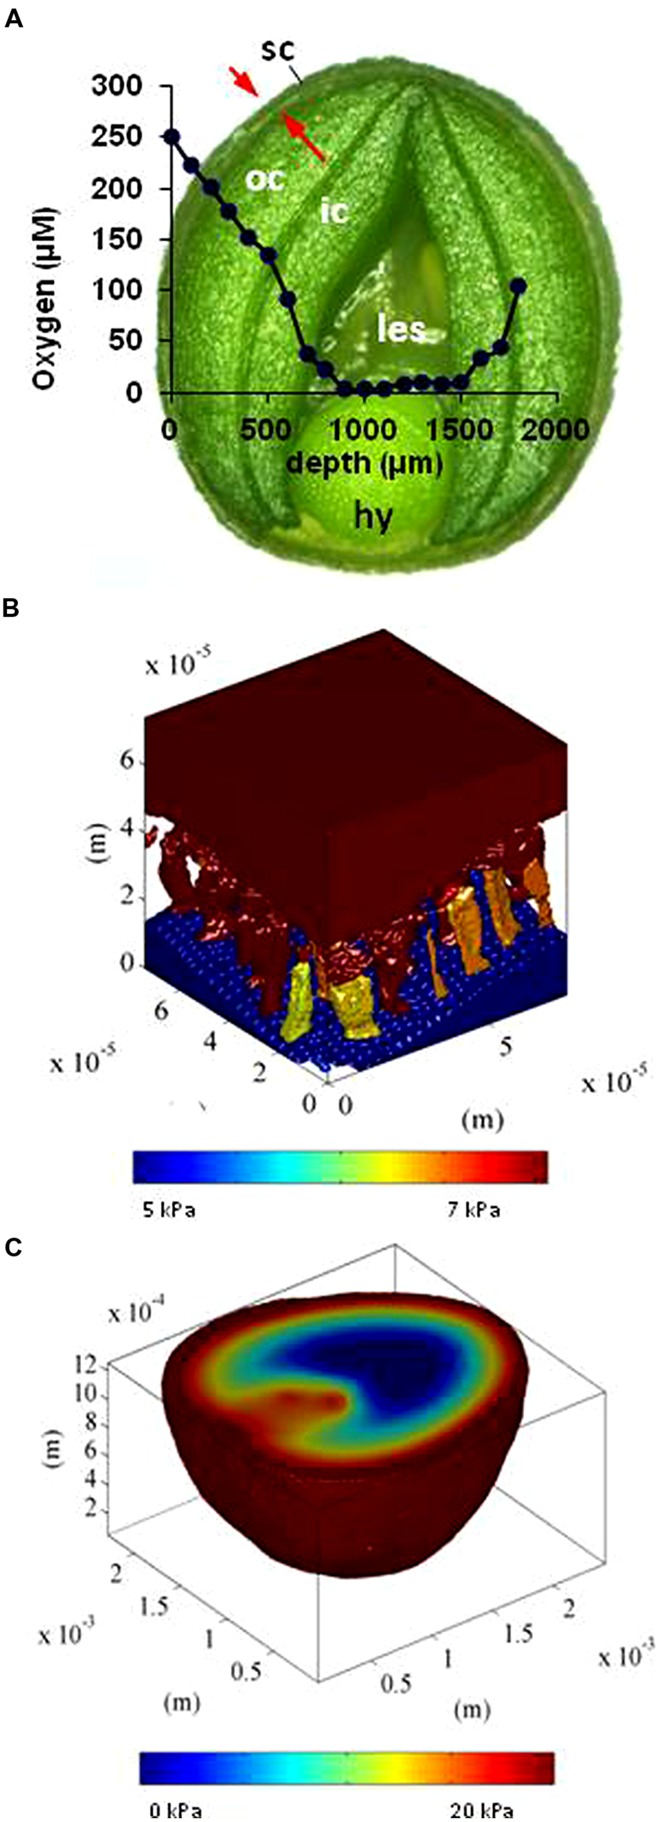
FIGURE 2.

Experimental measurements and in silico modeling of oxygen distribution in the developing oilseed rape seed. (A) Oxygen concentration (blue line) along a transect of the seed, as determined by a needle micro-sensor. The x axis plots the penetration of the sensor. (B) In silico modeling of oxygen concentration in the pore spaces of the seed coat [indicated by arrows in (A)]. (C) Oxygen concentration map (color-coded). For details see Verboven et al. (2013). hy, hypocotyl; ic, inner cotyledon; les, liquid endosperm; oc, outer cotyledon; sc, seed coat.
