Figure 10.
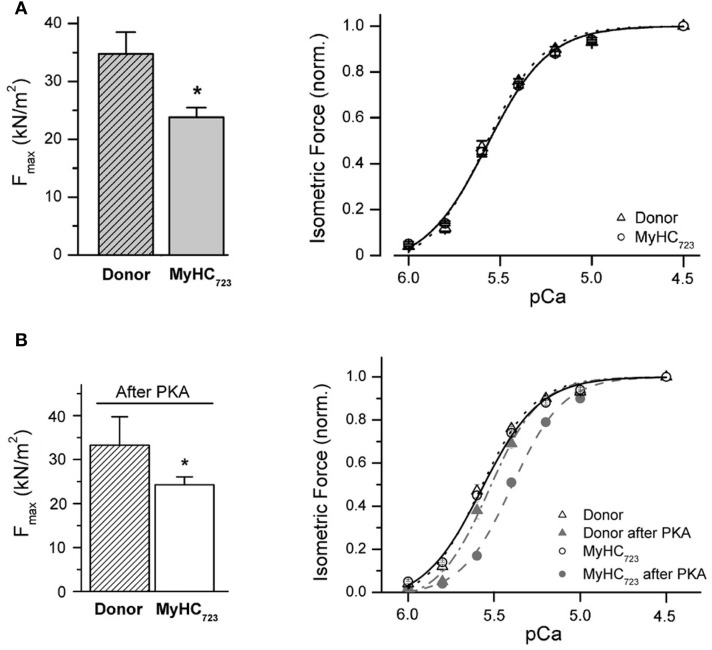
Effect of mutation R723G in myocardium. (A) Isolated cardiomyocytes, native state of phosphorylation. Left panel, maximum active force per cross sectional area at saturating calcium-concentration (Fmax). Fmax of MyHC723-cardiomyocytes (light gray bar) is 35% lower than Fmax of donor cells (hatched bar; *p < 0.05). Right panel, force-pCa relation normalized to maximum force at saturating Ca++-ion concentration (pCa 4.5). Solid and dotted lines, fits of a modified Hill equation yielding pCa50. Note that opposite to M. soleus fibers, cardiomyocytes isolated from a tissue sample of an explanted heart show a decrease in maximum active force with no shift in the force-pCa relation. (B) Isolated cardiomyocytes after incubation with protein kinase A (PKA) to match phosphorylation of contractile proteins, particularly of cTnI. Left panel, Fmax after treatment with PKA *p < 0.05. Note that PKA-treatment does not change the difference in Fmax between R723G-cardiomyocytes and controls. Right panel, force-pCa relations of MyHC723-cardiomyocytes (gray filled circles, dashed line) vs. donor cardiomyocytes (gray filled triangles, dashed-dotted line). Note the shift of the force-pCa relation of MyHC723-cardiomyocytes vs. donor after PKA treatment. For comparison force-pCa relations obtained before PKA treatment are also plotted in the same graph (open circles and solid line, MyHC723-cardiomyocytes; open triangles and dotted line, controls). Lines are fits of modified Hill equation to data points. Note that after PKA-treatment to match phosphorylation of e.g., cTnI, a similar reduced Ca++-sensitivity becomes detectable for MyHC723-cardiomyocytes just like that seen in the soleus fibers. Modified from Kraft et al. (2013). With permission of the Journal of Molecular and Cellular Cardiology.

