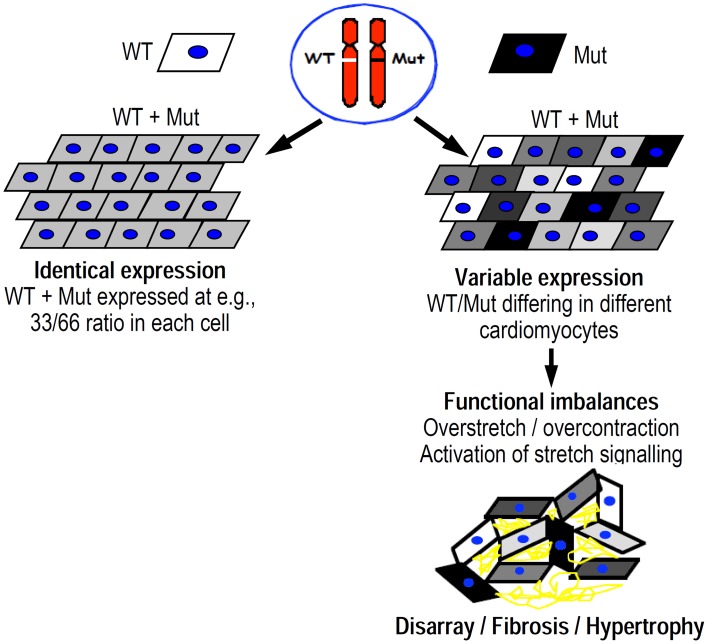
Figure 11.
Scheme illustrating the difference between equal abundance of mutant protein in all cardiomyocytes (top left) vs. variation in abundance among individual cardiomyocytes (top right). Gray level illustrates abundance of mutant protein. Unequal abundance of mutant protein in individual cardiomyocytes results in functional imbalance that distorts the cellular network of the myocardium (bottom right). Overstretch vs. overcontraction results in highly variable activation of e.g., stress/strain signaling with development of disarray, hypertrophy, and interstitial fibrosis in the long run.

