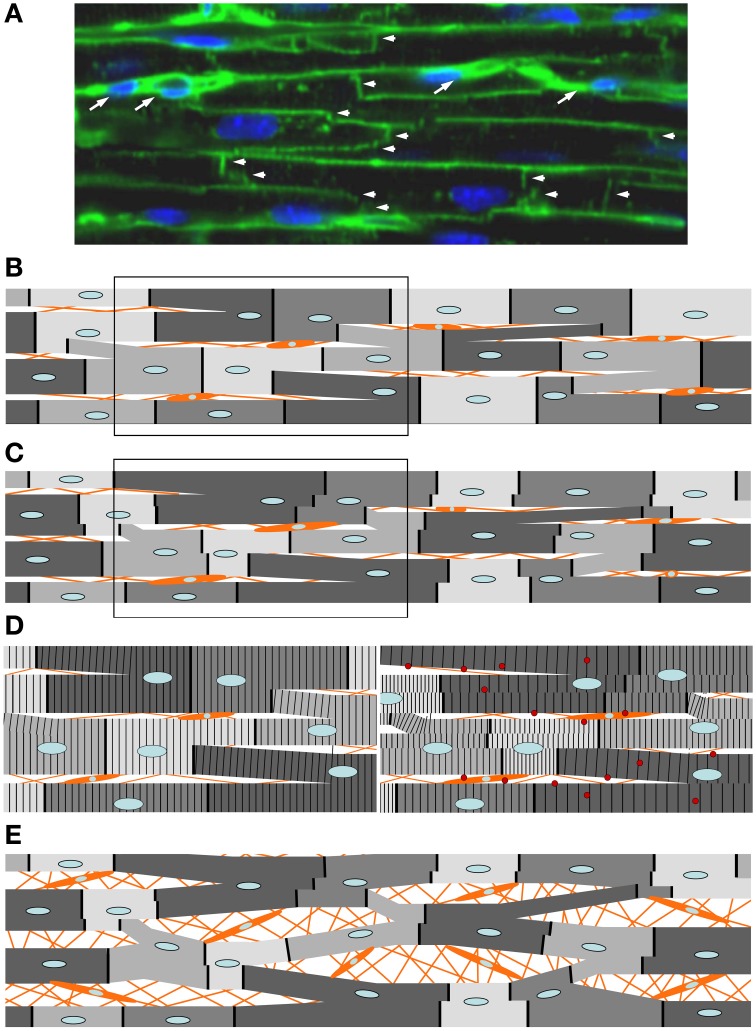
Figure 12.
Expected response of the cellular network of myocardium to imbalances in force generation among individual cardiomyocytes, e.g., by mutations R719W or R723G. Orange lines and orange cells represent extracellular connective tissue and non-myocyte cells within the myocardium. (A) Confocal image of a longitudinal section through myocardium (adult mouse). Intercalated discs (vertical lines and “staircases” labeled with arrow heads) labeled with a mouse monoclonal antibody to pan Cadherin and an Alexa 488-linked goat-anti-mouse antibody. Horizontal lines are plasma membranes visualized by staining glycoproteins containing β-N-acetyl-D-glucosamine with FITC-conjugated wheat germ agglutinin (for details see Schipke et al., in press). TO-PRO®-3 Iodide used for staining nuclei (blue). By this approach, individual cardiomyocytes are delineated. Note that individual cardiomyocytes are not arranged in independent columns. Instead, cardiomyocytes make contact via intercalated discs with cardiomyocytes of adjacent columns resulting in a cellular network. Presumed non-myocyte cells are labeled with white arrows. (B) Schematic representation of the cellular arrangement in myocardium with branched cardiomyocytes while relaxed. The darker the gray-level the higher the abundance of the mutant myosin. The mutation is assumed to result in substantially lower forces at partial activation levels despite higher force at maximum activation, as was seen for mutations R719W and R723G (cf. Figure 8) (C) Same cellular network during contraction (partial activation like in a twitch). For cardiomyocytes with mutations R723G or R719W higher abundance of the mutant myosin (darker gray levels) results in lower forces at partial activation. Thus, during a twitch these cardiomyocytes become overstretched by those with low abundance of the mutant protein (lighter gray levels). Due to the branching, different parts even of individual cells will experience different forces by the different connections with neighboring cells and will therefore shorten or be stretched to different extent (see steps in intercalated discs, represented by dark solid vertical lines separating adjacent cells). Due to relative movement of cells in parallel strands, branches between the strands will be distorted as will be the non-myocyte cells in between the strands of cardiomyocytes. (D) Left panel, boxed part of (B) magnified to illustrate striation pattern; right panel, boxed part of (C). Note the developing differences in sarcomere lengths of myofibrils during contraction even within an individual cell. This is due to the branching of the cells and the different forces acting on the branches due to the unequal force generating capability of adjacent cells by the different abundance of mutant protein (functional imbalance). Thus, functional imbalance among individual cardiomyocytes together with the cellular network of the cardiomyocytes are expected to trigger cellular and myofibrillar disarray whenever, by variation in expression, a mutation causes unequal force generation among individual cardiomyocytes during a twitch. This state would represent the profibrotic state of the myocardium (Ho et al., 2010) in which stretch triggers increased expression of e.g., Tgf-β (red spheres) by cardiomyocytes and non-myocyte cells activating development of interstitial fibrosis. Such distortion will take place during force generation (pressure development) and will be enhanced during shortening under load (ejection period). This will occur even if maximum shortening velocity is unaffected by the mutation because the relative load will be lower for “strong” cells (low abundance of mutant protein) vs. “weak” cells (high abundance of mutant protein). Note, that if the mutant protein were expressed equally in all cells, force generation at any time during a twitch would be affected equally and no or only minimal changes in the arrangement of cardiomyocytes would take place during a twitch, i.e., no or only much smaller changes from the arrangement in (B) would be seen. Panel (E) illustrates a later stage of phenotype development when e.g., stretch-sensitive signaling has triggered development of interstitial fibrosis with increased cellular disarray. The increase in cell size by signaling paths that trigger hypertrophy is not shown.

