
Figure 1.
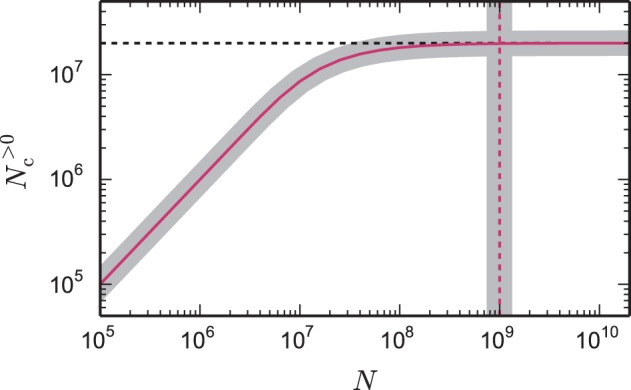
Number of local target lists approaches the number of local synapses. The gray curve shows the expected number of target lists per core N>0c, given by Equation (6), that contain at least one synapse as a function of the total network size N. The pink curve (1 − exp(− KVP/N))N is an approximation (7) for large networks. Here, each core represents NVP = 2000 neurons with K = 10,000 synapses per neuron, which is a realistic example. In the limit of large N the number of target lists approaches the number of local synapses KVP = KVP (black dashed horizontal line). The gray vertical line marks the network size Nζ, given by Equation (9), at which the number of target lists has reached ζ = 99% of the limit KVP. The pink dashed vertical line at KVP/2/(1 − ζ) is an approximation (10) of the full expression (9).