
Figure 9.
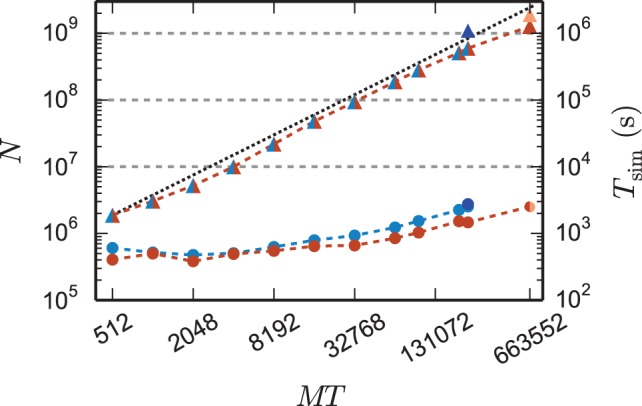
Maximum network size and corresponding run time as a function of number of virtual processes. Triangles show the maximum network size that can be simulated with parameter set 1 (cf. Section 2.2) on the K computer (red) and on JUQUEEN (blue) when using the 4g technology with T = 8 threads per compute node. The dotted black line indicates the ideal case where the network size increases with the same factor as the number of virtual processes. Dark blue (JUQUEEN) and orange (K) triangles represent the maximum network size using all compute nodes and parameter set 2 (JUQUEEN: 1.08 · 109 neurons, K: 1.86 · 109 neurons). Filled circles show the corresponding wall-clock time required to simulate the network for 1 s of biological time.