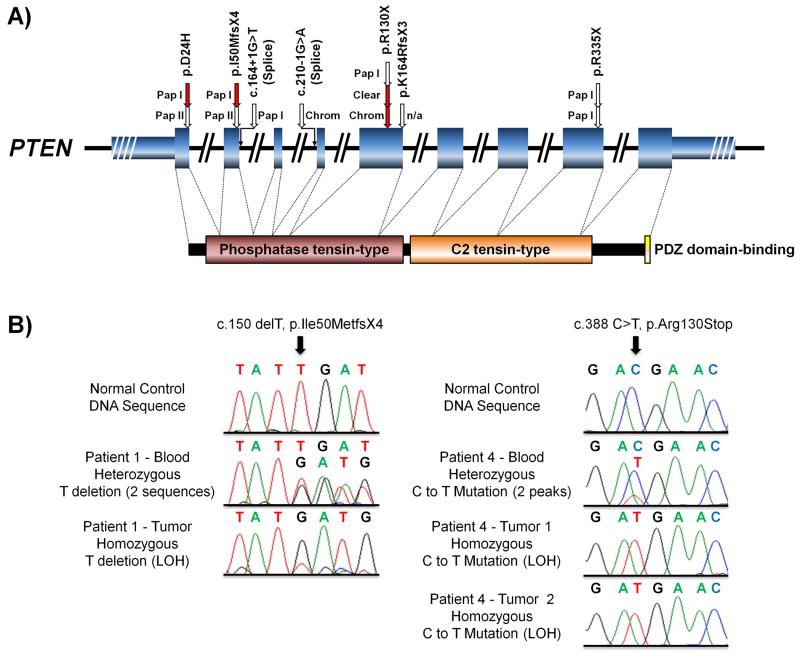
Figure 5. PTEN mutation map for CS-RCC and Evidence of PTEN loss of heterozygosity (LOH).
A) A schematic of the PTEN demonstrates the 9 coding exons (fat blue boxes) and the 5′ and 3′ UTRs (thin blue boxes) with the known functions domains shown below linked to their relevant coding exons (P60484 – http://www.uniprot.org/). The mutations from this report (red arrows) were combined with the recent series reported by Mester and colleagues10 (white arrows) and mapped to the PTEN gene with annotation of the reviewed pathology. Pap I – Papillary Type 1, Pap II – Papillary Type 2, Chrom – Chromophobe, Clear – Clear Cell.
B) The loss of heterozygosity (LOH) was assessed in all tumors and two examples are shown here. The left panel demonstrates normal control sequence followed by heterozygous deletion of a T in the blood DNA of Patient 1, creating a frameshift, and LOH of the frameshift in the tumor DNA. The right panel demonstrates normal control sequence followed by heterozygous substitution of a C for a T in the blood DNA of Patient 4 and LOH of this mutation in the DNA of both the assessed tumors.

