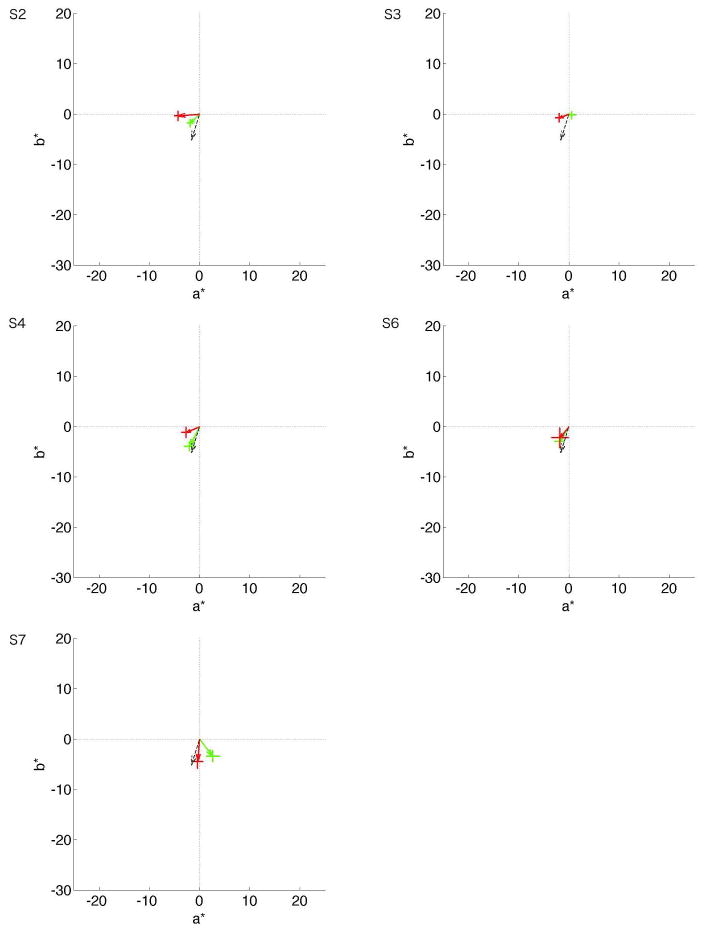
Figure 8.
Mean constancy for Banana and Rectangle contextual object conditions, Experiment 3. Same basic format as Figure 6 and Figure 7 above. Upper left graph shows S2’s data, upper right graph shows S3’s data, middle left graph shows S4’s data, middle right graph shows S6’s data, and lower left graph shows S7’s data. Green and red arrows indicate the mean color constancy shift for the Banana and Rectangle contextual object conditions respectively. To indicate the direction of the constancy prediction, the black dashed arrows show the corresponding average of the constancy predictions, at 1/5 the overall vector length.

