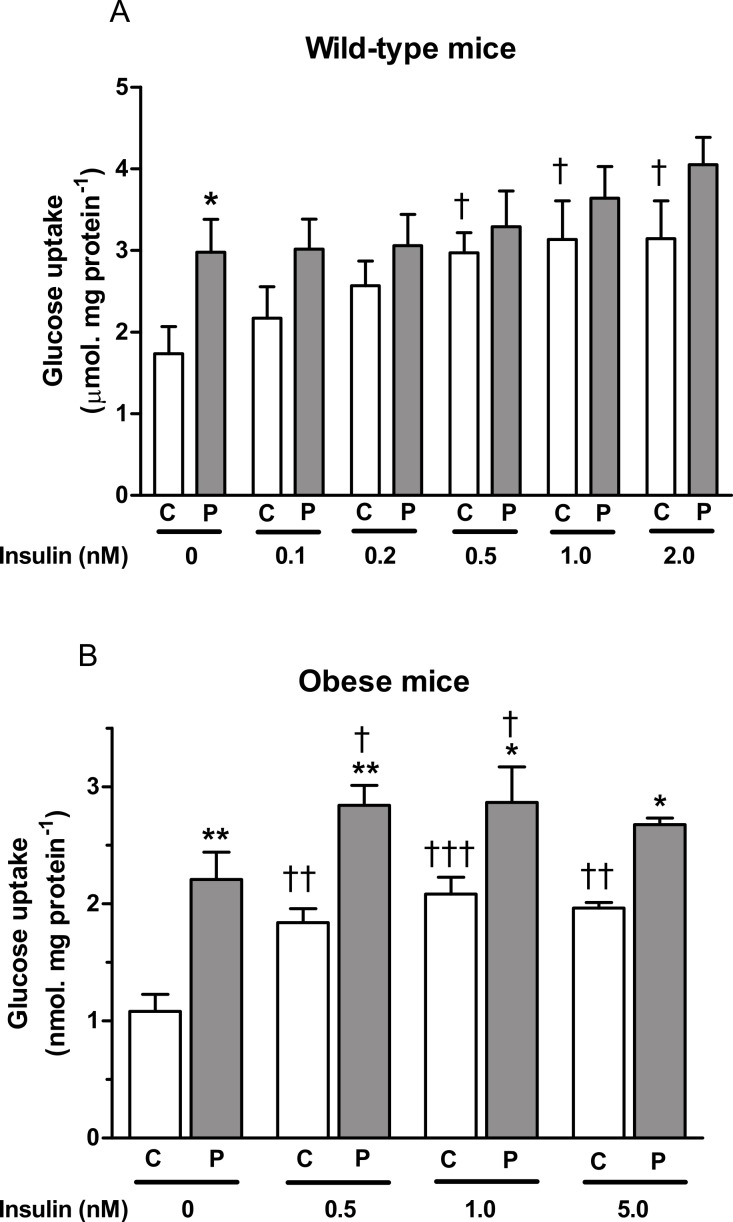
Figure 2. Effect of PAP-1 on glucose uptake in adipocytes of female (A) wild-type and (B) ob/ob C57Bl6 mice.
Adipocytes were treated with insulin, PAP-1 (P, 3 µM) alone, or a combination of insulin and PAP-1. n = 8 mice per group for all columns. Data for each genotype were analyzed by two-way ANOVA (sources of variation: PAP-1 and insulin concentrations), followed by Fisher’s least significant difference test, first for the paired columns at the same concentration of insulin, and second to test for an effect of insulin compared to the value obtained in the absence of insulin but in the presence of the same concentration (0 or 3 microM) of PAP-1. ∗ P < 0.05; ∗∗P < 0.01 for effect of PAP-1 compared to controls at the same concentration of insulin (C). †P < 0.05; ††P < 0.01; †††P < 0.001 for effect of insulin compared to no insulin at the same concentration of PAP-1.

