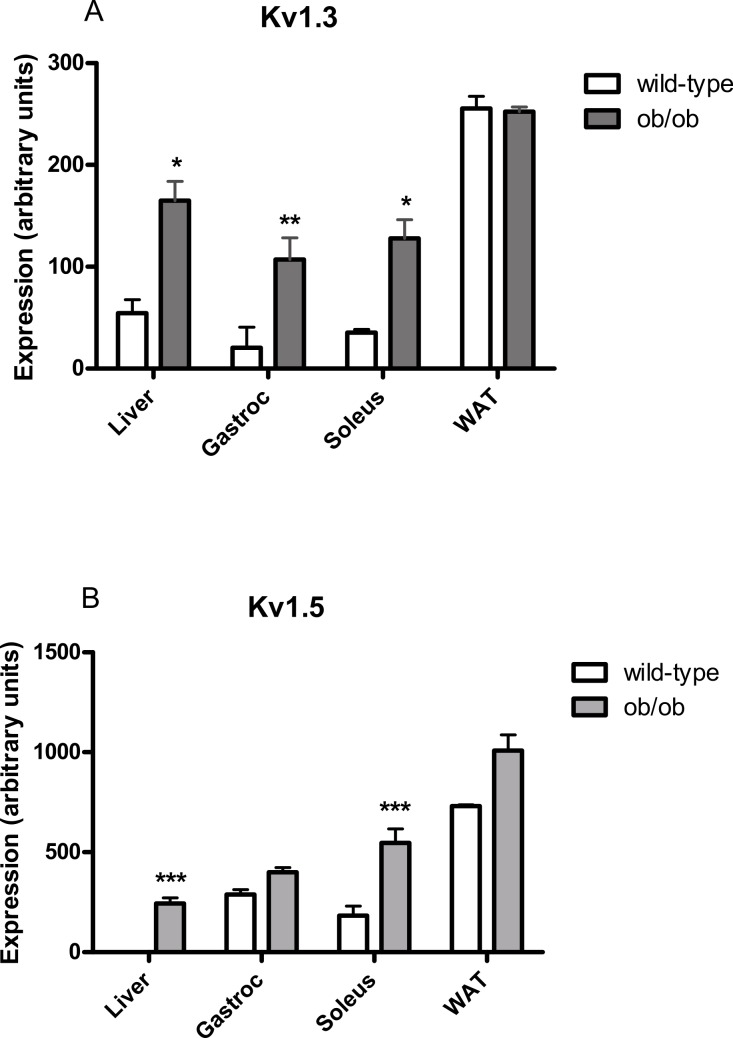
Figure 5. Kv1.3 and Kv1.5 mRNA levels in liver, gastrocnemius, soleus and white adipose tissue of female (A) wild-type and (B) ob/ob mice.
n = 3 mice for all columns. Expression of each potassium channel was calculated relative to expression of GAPDH in each sample. Data were log10-transformed prior to statistical analysis because the data obtained for Fig. 6 suggested that widely distributed data did not follow a normal distribution without this transformation. Analysis was by two-way ANOVA (sources of variation: genotype and tissue) for each gene, followed by Fisher’s least significant difference test for each pair of wild-type and ob/ob values. Unpaired t-tests conducted on untransformed data gave the same significant differences. ∗P < 0.05; ∗∗P < 0.01; ∗∗∗P < 0.001 compared to wild-type mice.

