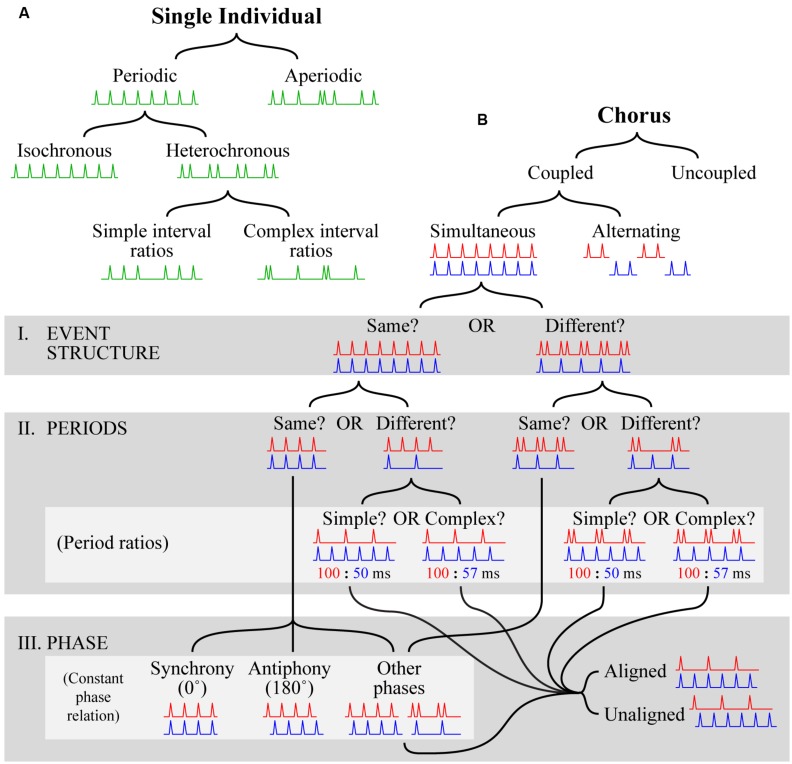
FIGURE 2.
Visual depiction of the proposed definitional framework. (A) The solo tree hierarchically categorizes temporal patterns produced by a single individual. Categorization is accomplished by starting at the top and following the black lines down according to which branch provides a better fit at each level. Visual examples are shown in green at each level as a guide. Each example depicts a progression of events (spikes) in time (x-axis; left to right) that satisfies the conditions for inclusion in a particular category. For space reasons, the tree is only filled out for periodic patterns; for further description of aperiodic patterns see the main text. (B) The chorus tree hierarchically categorizes temporal patterns produced by multiple individuals. The format is the same as in (A), with the exceptions that two patterns (red, displayed at the top, and blue, displayed at the bottom of each pattern pair) are necessary to show examples of category membership, gray boxes are used to highlight groups of categories (labeled according to the names following the roman numerals I–III), and light gray boxes are used to highlight subgroups of categories (labeled according to names in parentheses). In the light gray box labeled “period ratios”, the ratios given beneath each visual example relate the periods of the corresponding example patterns in milliseconds. For space reasons, the tree is only filled out for coupled simultaneous patterns; for further description of uncoupled choruses and coupled alternating choruses see the main text.

