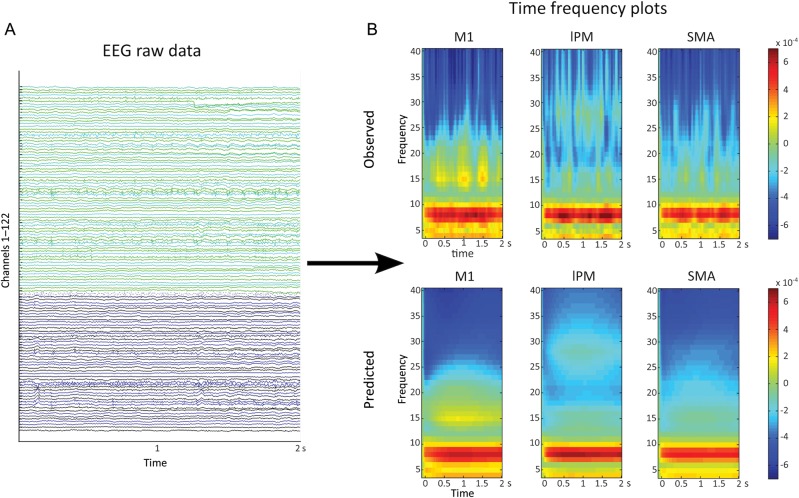
Figure 4.
Spectral responses. (A) EEG raw data during the motor task. Data of a 2-s epoch is shown for a representative patient. (B) Time–frequency transformation of EEG data. The observed spectra (averaged over trials) of the same patient as in 4A are shown in the upper panel, the spectra predicted by model 1 (the best model) are shown in the lower panel. It can be clearly seen that model 1 provided a good fit explaining ∼95% variance of the data (Control group: 93.4%; PD-OFF 95.1%; PD-ON 96.3%).

