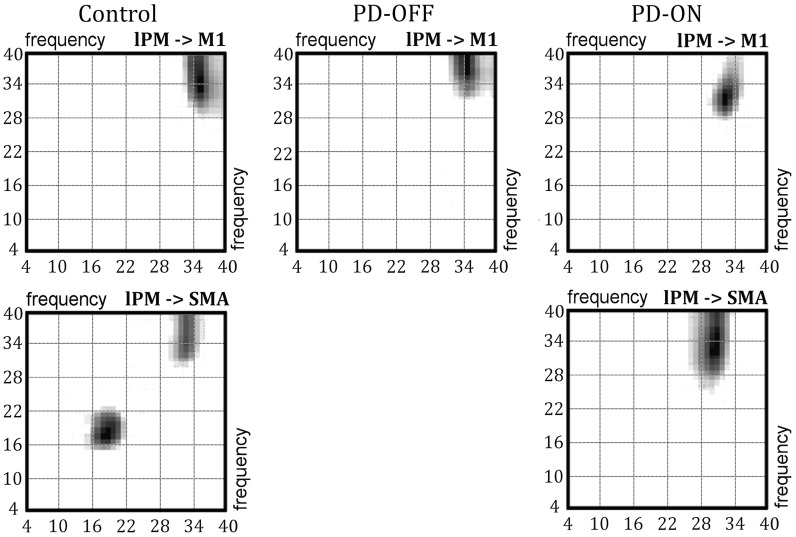
Figure 6.
Frequency–frequency matrices. The matrices (4–40 Hz) of connections from lPM to M1 (first row) and from lPM to SMA (second row) are illustrated. The left column shows matrices from the healthy control group, the middle column shows matrices from PD patients OFF medication, and the right column shows matrices from PD patients ON medication.

