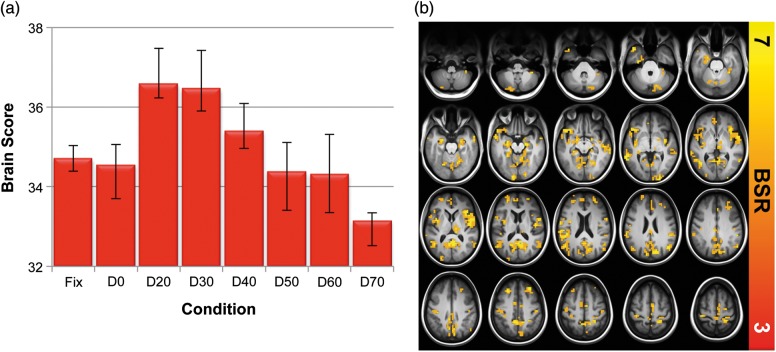
Figure 3.
SDBOLD multivariate analyses. (a) Contrast expressing differences across all conditions. (b) Spatial pattern expressing the contrast in (a). The effect was such that higher brain scores reflected higher signal variability in yellow/red regions. Error bars represent bootstrapped 95% confidence intervals. Statistical robustness (BSR, or bootstrap ratio) increases from red to yellow in (b).

