
Figure 5.
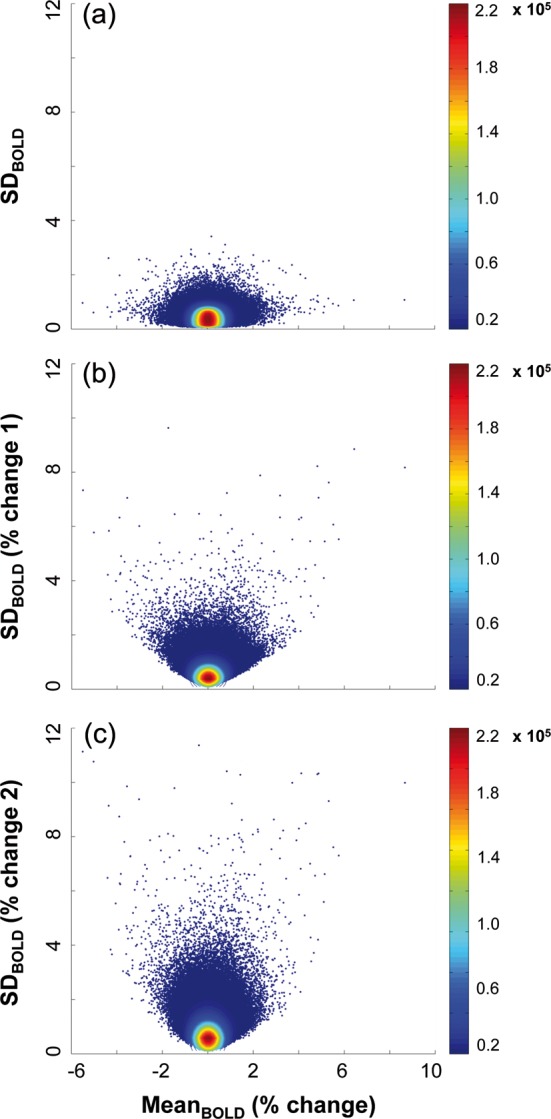
Lack of relations between meanBOLD and 3 types of SDBOLD. SDBOLD in (a) represents our typical method of calculation. In (b), SDBOLD is calculated on percent change data derived from using block means as the anchor points for trial data (i.e., “% change 1”). In (c), SDBOLD is calculated on percent change data derived from using initial block scans as the anchor points for trial data (i.e., “% change 2”). This latter calculation on trial data is identical to what we used prior to calculating MeanBOLD (% change). In each figure, data clouds represent all voxels per subject and condition (14 346 voxels × 18 subjects × 8 conditions = 2 065 824 data points). Color bars reflect density within the data clouds.