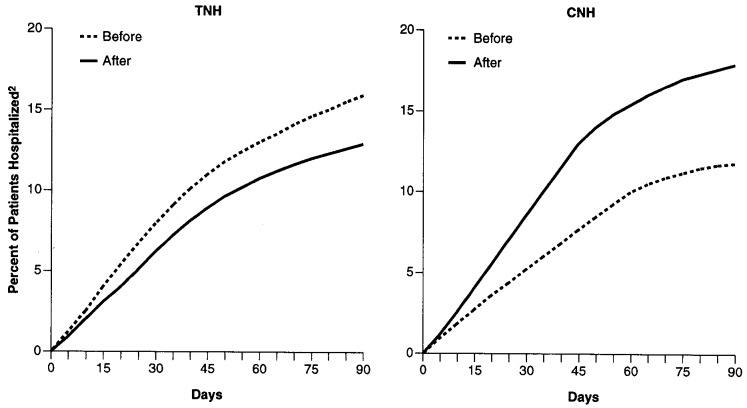
Figure 1. Cumulative Percentage Distributions of TNH and CNH Patients Hospitalized Within 3 Months of Nursing Home Admission: Before and After Implementation of the TNHP1.
1 Retrospective and prospective admission sample sizes are presented in the article. The number of valid cases for each variable differs somewhat due to the exclusion of cases with incomplete or missing data for covariates.
2 The before/after differences, both unadjusted (not shown) and adjusted, between the TNH and CNH pairs of survival curves are significant (p < .05), indicating that the reversal or crossover pattern of hospitalization rate changes for TNHs and CNHs is substantiated by survival analysis. Eight case-mix variables were significant at p < .15: (1) a case-mix index reflecting expected need (time required) for nursing and aide services; (2) admitted to nursing home from hospital; (3) urinary incontinence or catheter; (4) disability in feeding; (5) shortness of breath requiring oxygen; (6) number of routine medications; (7) diagnostic category for mental disorders; and (8) diagnostic category for fractures.
NOTES: “Before” includes 1981-82. “After” includes 1985-87. TNH is teaching nursing home. CNH is comparison nursing home. Distribution curves have been case-mix adjusted.
SOURCE: Primary data collected by nursing home and research staff on Teaching Nursing Home Program study patients (from TNHs and CNHs).

